リソース割り当ての割合を表示するにはどうすればよいですか?

バックグラウンド

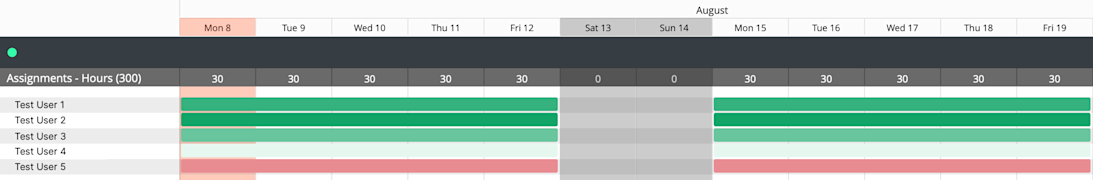
リソース計画ツールは、リソースの可用性、リソース要求、およびリソース割り当てに関するリアルタイムの洞察を提供します。リソース要求と割り当てを作成し、その個人に割り当てられている時間数、またはプロジェクトに割り当てられている時間の割合に基づいてそれらを表示できます。

入力した「配分タイプ」 (時間またはパーセント) に関係なく、割り当てガントを構成して、パーセンテージに基づいてプロジェクトに人々がどのように割り当てられているかを示すことができます。これは、次のことに役立ちます。

  • 複数のプロジェクトに取り組む際に、人々の時間がどのように割り当てられているかを理解する

  • プロジェクトがキャパシティで稼働していることを確認する

  • 労働時間の超過を特定する

 Tip

You can use this feature for forecasting by updating the visibility of the assignment status. See Configure Request and Assignment Statuses for Resource Planning.

Answer

Allocation percent is calculated based on the working hours ('Paid Hours Per Shift') set in your Costing settings. Allocations only account for 'Paid Hours Per Shift', regardless of the assignment's scheduled hours or the project's default start and end times. To show labor overages, you must enable overtime. See Configure Costing in Resource Planning.

Example

A company has eight paid hours per shift configured in their Costing settings. Overtime is not enabled.

An assignee is assigned a 10 hour shift. Allocation displays 100% based on the paid hours per shift.

A company has 8 paid hours per shift configured in their Costing settings. Overtime is enabled.

An assignee is assigned a 10 hour shift. Allocation reflects 125%.

On the Assignments Gantt, you can see percent allocation by:

  • People

  • Project

View Allocation Percentage by People

Viewing allocation percentage by people helps you identify labor overages and to ensure your project is operating at its full capacity.

When viewing allocation by people, you have two options:

  1. You can see percentage allocation in the 'Totals' column to display the person's total allocation per day.

  2. You can set 'Assignment Color Bars' to reflect a person's allocation percentage for their assignment. Allocation percentage is reflected by different shades of green and red. As the allocation percentage increases, the shading changes from light to dark. When someone's allocation reaches over 100% for a single project, and overtime is enabled, the highlighting turns red.

Example

In this example, people are assigned and working across two projects, C Base Project and Support Building. The Costing Settings are set to 8 working hours.

  • Test User 1 is scheduled for 6.5 hours per day at C Base Project and 1.5 hours per day at Support Building. The total allocation is 100%.

  • Test User 2 is scheduled for 8 hours per day at C Base Project. The total allocation is 100%.

  • Test User 3 is scheduled for 5 hours per day at C Base Project and 2 hours per day at Support Building. The total allocation is 88%.

  • Test User 4 is scheduled for one hour per day at C Base Project and 8 hours per day at Support Building. The total allocation is 113%.

  • Test User 5 is scheduled for 8 hours per day, plus two hours of overtime per day. The total allocation is 125%.

To view allocation percentage by people:

  1. Navigate to the Company level Resource Planning tool.

  2. Click Assignments and select **Gantt.

  3. Select the Group.
    clipboard_e1b95049a78faf6b27a84d4761a0c4f7e.png

  4. Select People.
    clipboard_e0b871ff5e884d4e53fad29cb0fcf5022.png

  5. Select your date range.

  6. Click Configure.
    clipboard_e5808ee86663606695c031217fe5d3ea7.png

    • Select 'Total Cell Units' to display column totals by Allocation.

    • Select to display Gantt 'Bars Solid/Split' by Solid Bars for the entire resource request or assignment, or Working Day Splits.

    • Select to show 'Assignment Bar Colors' by Allocation %.

  7. Click Apply.

View Allocation Percentage by Project

Viewing allocation percentage by project enables you to see how people are allocating their time to your specific project. It also allows you to see when people assigned to your project are working overtime.

When viewing allocation percentage by project, 'Assignment Color Bars' reflect different shades of green and red, representing their allocation. As the percentage of allocation increases, the intensity of the green increases. When someone's allocation reaches over 100% for a single project, and overtime is enabled, the color bar turns red.

Example

clipboard_ef1637c56e015d426ea855fedda18c966.png

In this example, the Costing Settings are set to 8 working hours with overtime enabled.

  • Test User 1 is scheduled for 6.5 hours per day.

  • Test User 2 is scheduled for 8 hours per day.

  • Test User 3 is scheduled for 5 hours per day.

  • Test User 4 is scheduled for one hour per day.

  • Test User 5 is scheduled for 8 hours per day, plus two hours of overtime per day.

To view allocation percentage by project:

  1. Navigate to the Company level Resource Planning tool.

  2. Click Assignments and select **Gantt.

  3. Select the Group.
    clipboard_e1b95049a78faf6b27a84d4761a0c4f7e.png

  4. Select Projects.
    clipboard_eec8772bcc04d4b76e7957914de087972.png

  5. Select your date range.

  6. Click Configure.
    clipboard_e5808ee86663606695c031217fe5d3ea7.png

    • Select to display Gantt 'Bars Solid/Split' by Solid Bars for the entire resource request or resource assignment, or Working Day Splits.

    • Select to show 'Assignment Bar Colors' by Allocation %.

  7. Click Apply.

See Also

Loading related articles...