Project Management Report
The Analytics Project Management Report is a robust reporting tool designed to provide comprehensive insights into various aspects of project management within the Procore platform. This report helps project managers, stakeholders, and team members track, analyze, and improve project performance by leveraging data from multiple project management tools within Procore.
Current Versions
2.0 - 25.03.13
Procore Tools Used in the Project Management Report
Correspondence
Directory (Project level)
Drawings
Meetings
Photos
Punch List
RFIs
Schedule (Project level)
Submittals
Report Pages
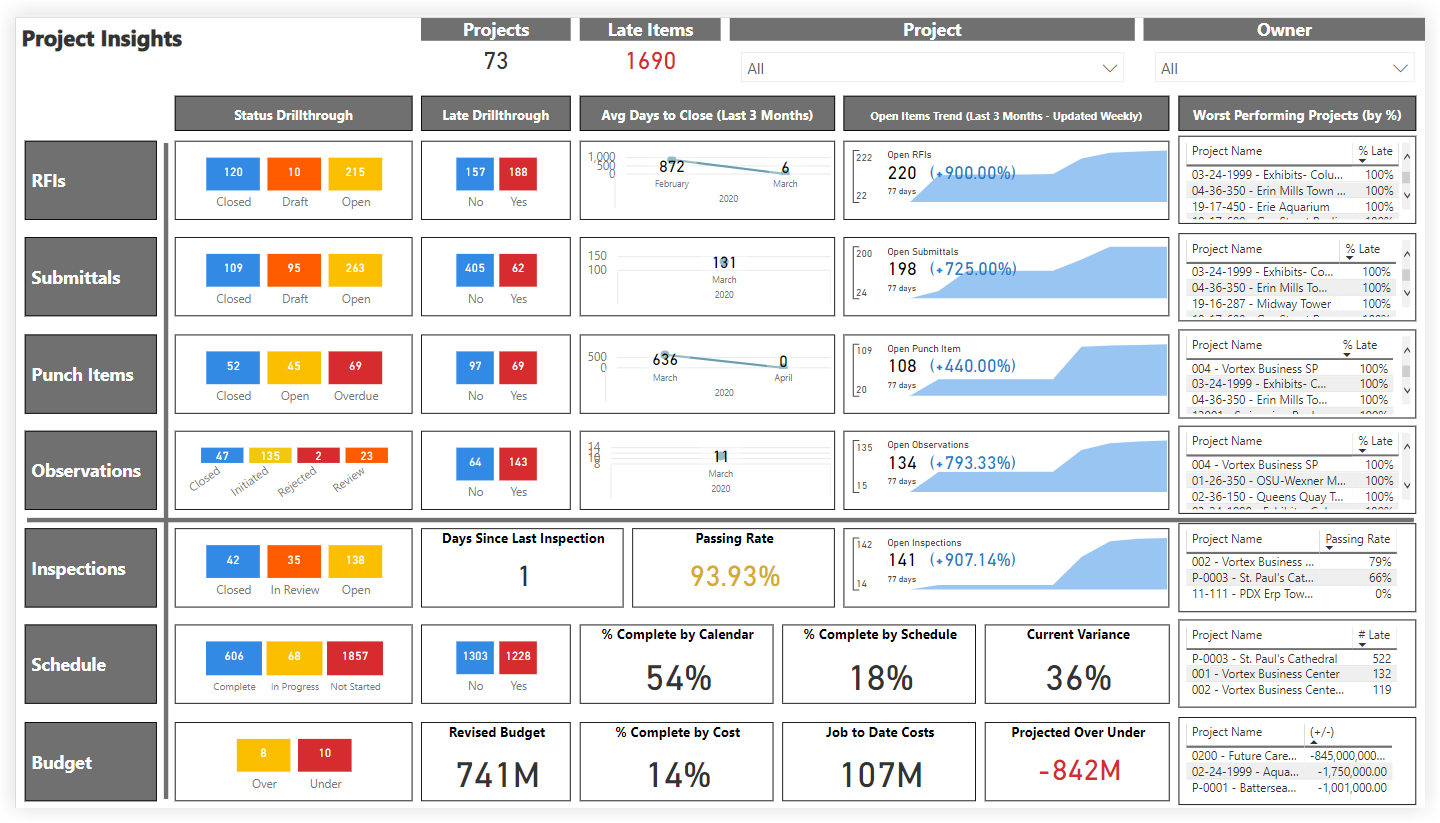
Project Insights
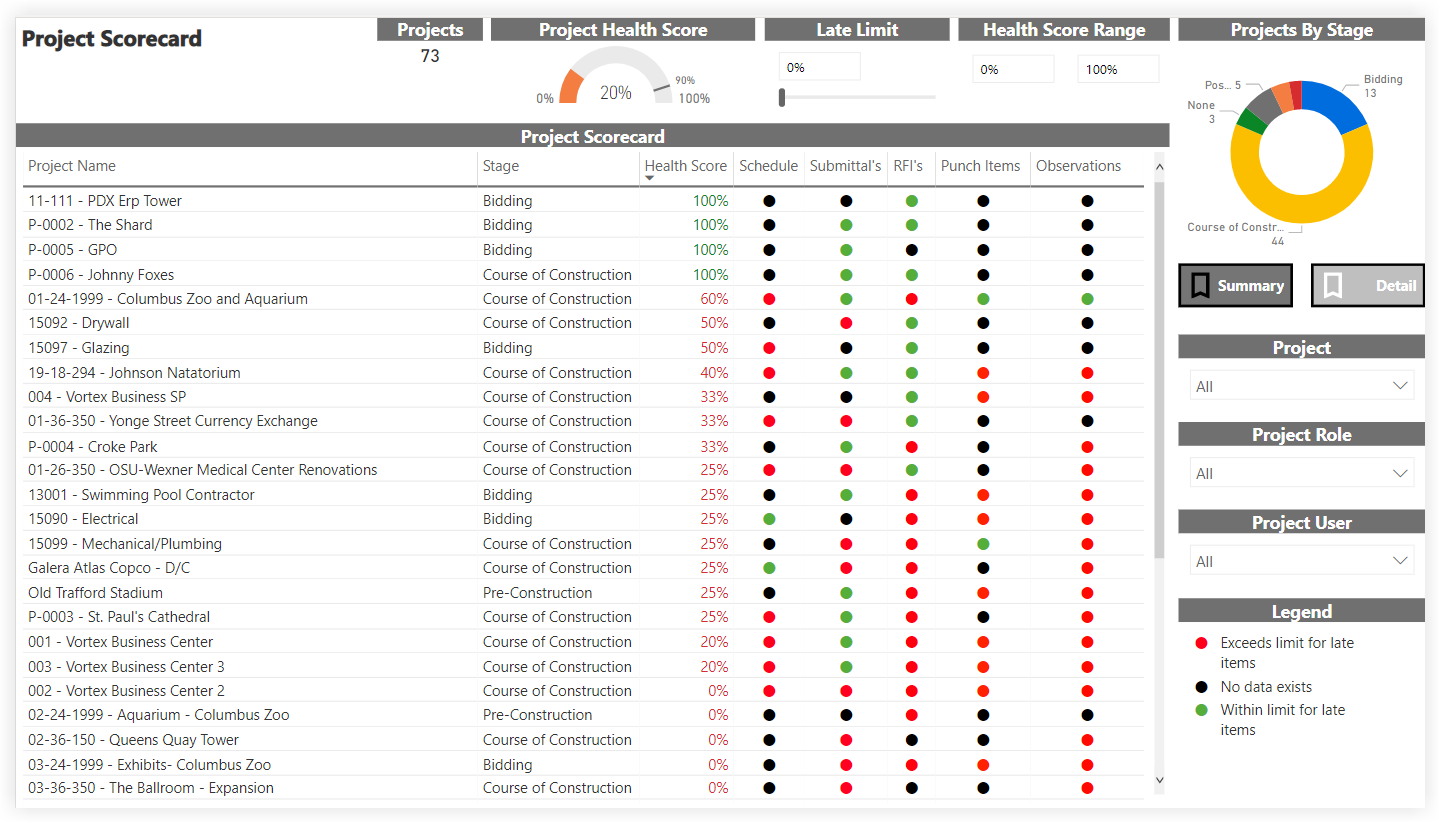
Project Scorecard
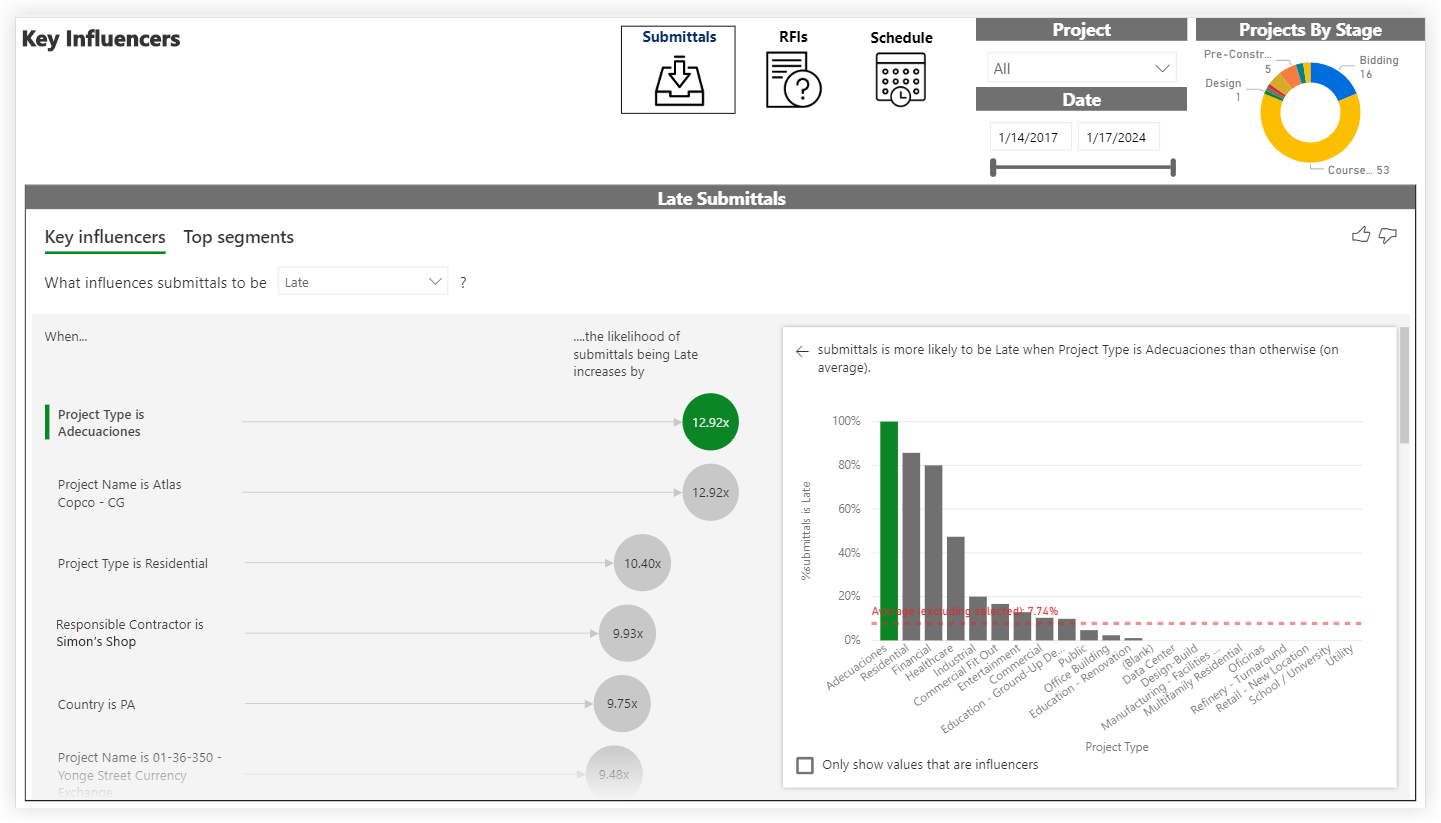
Key Influencers
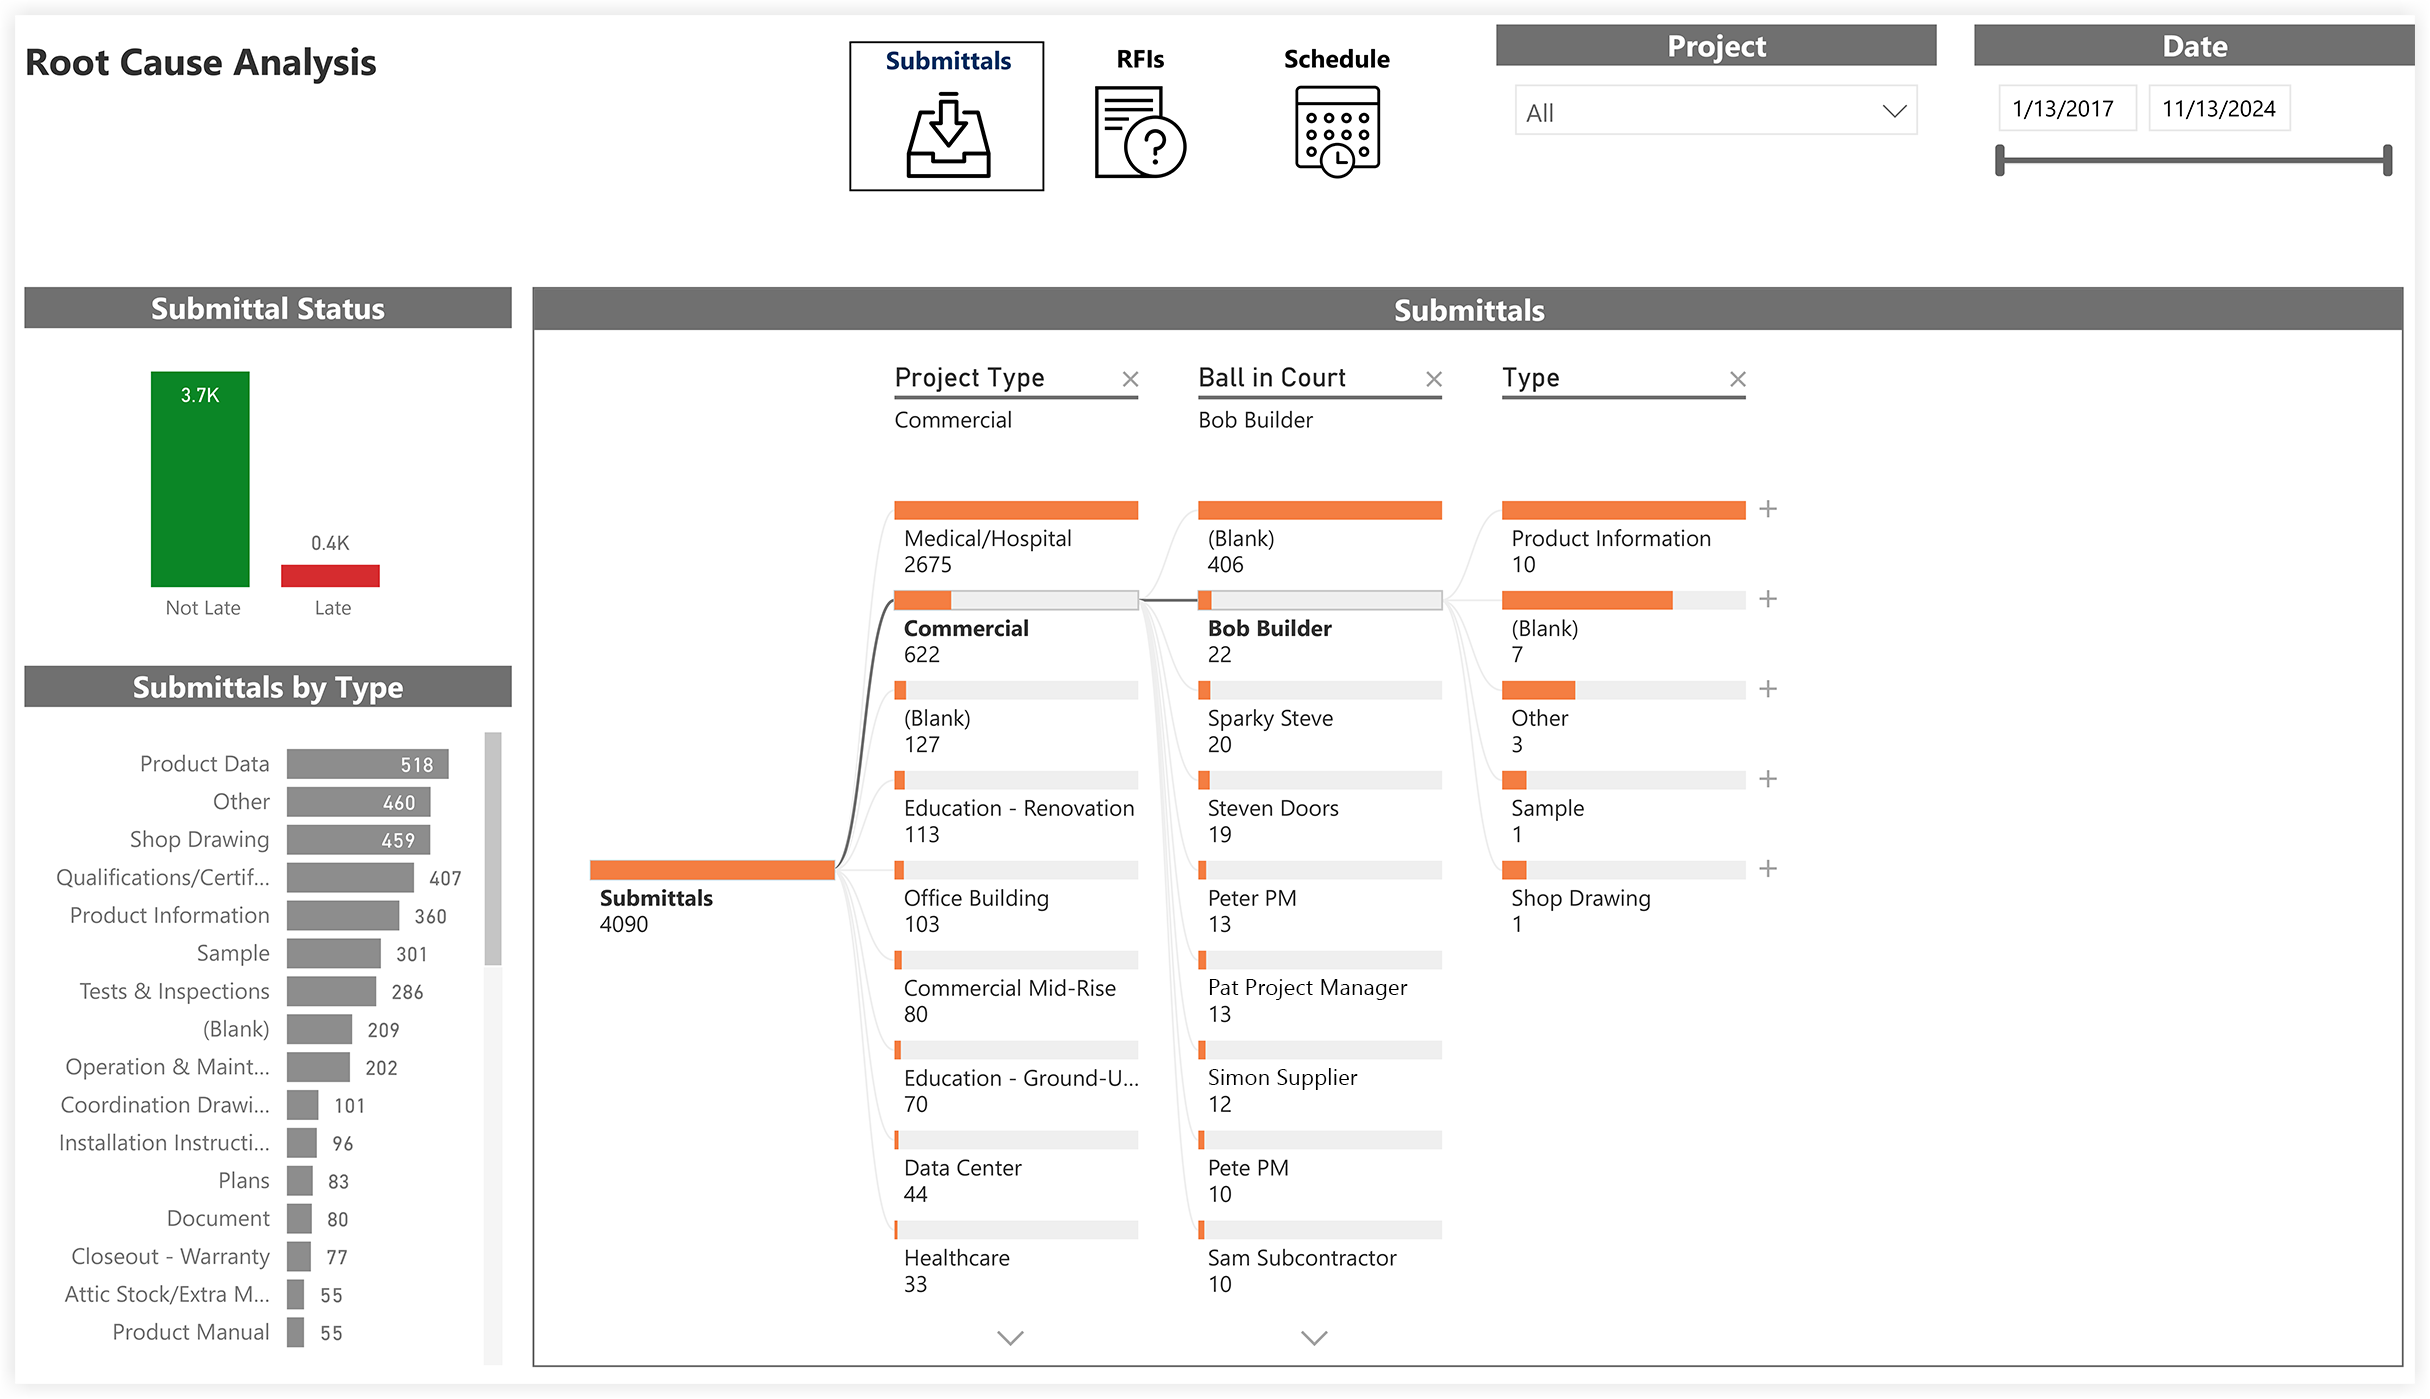
Root Cause Analysis
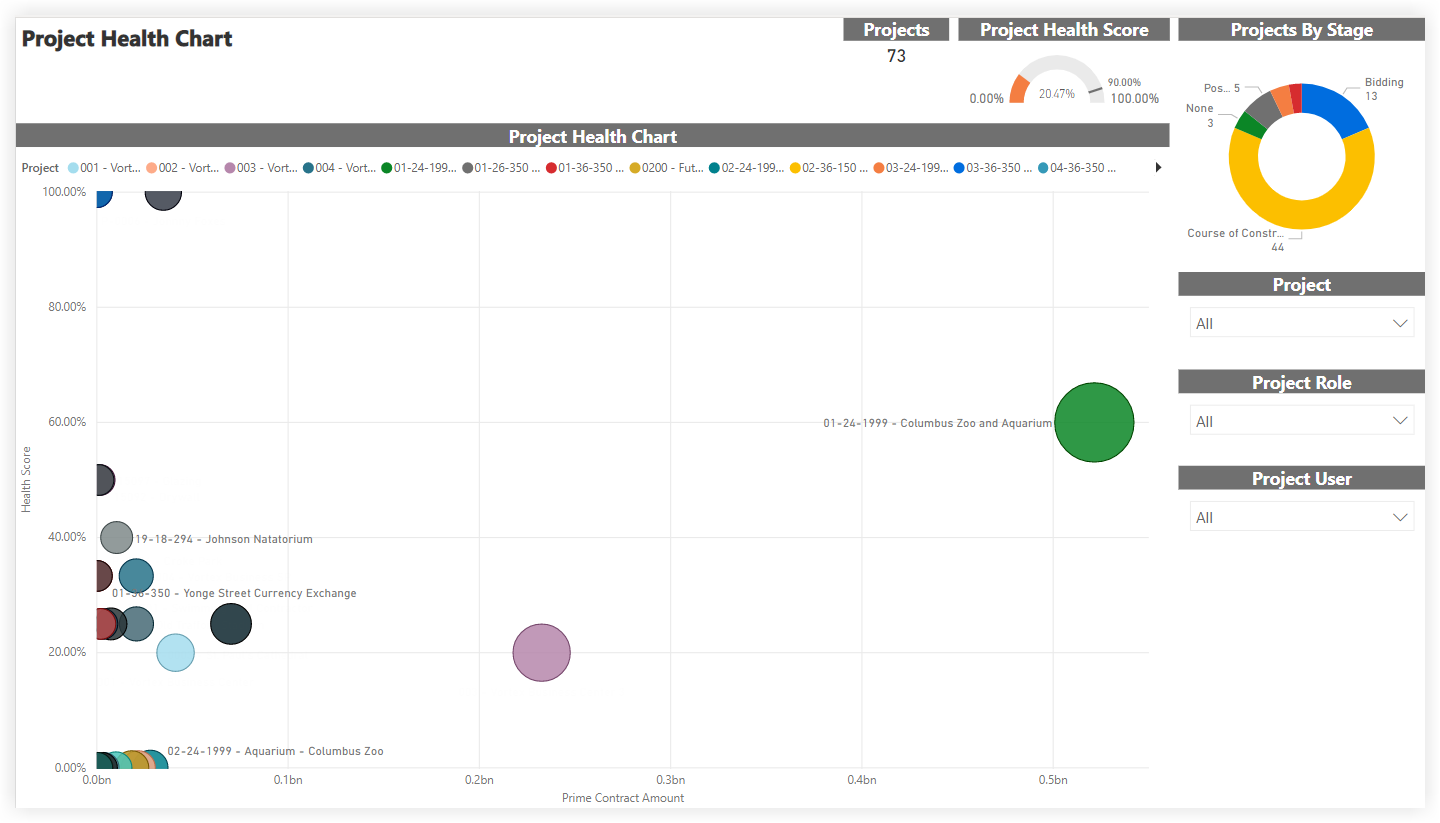
Project Health Chart
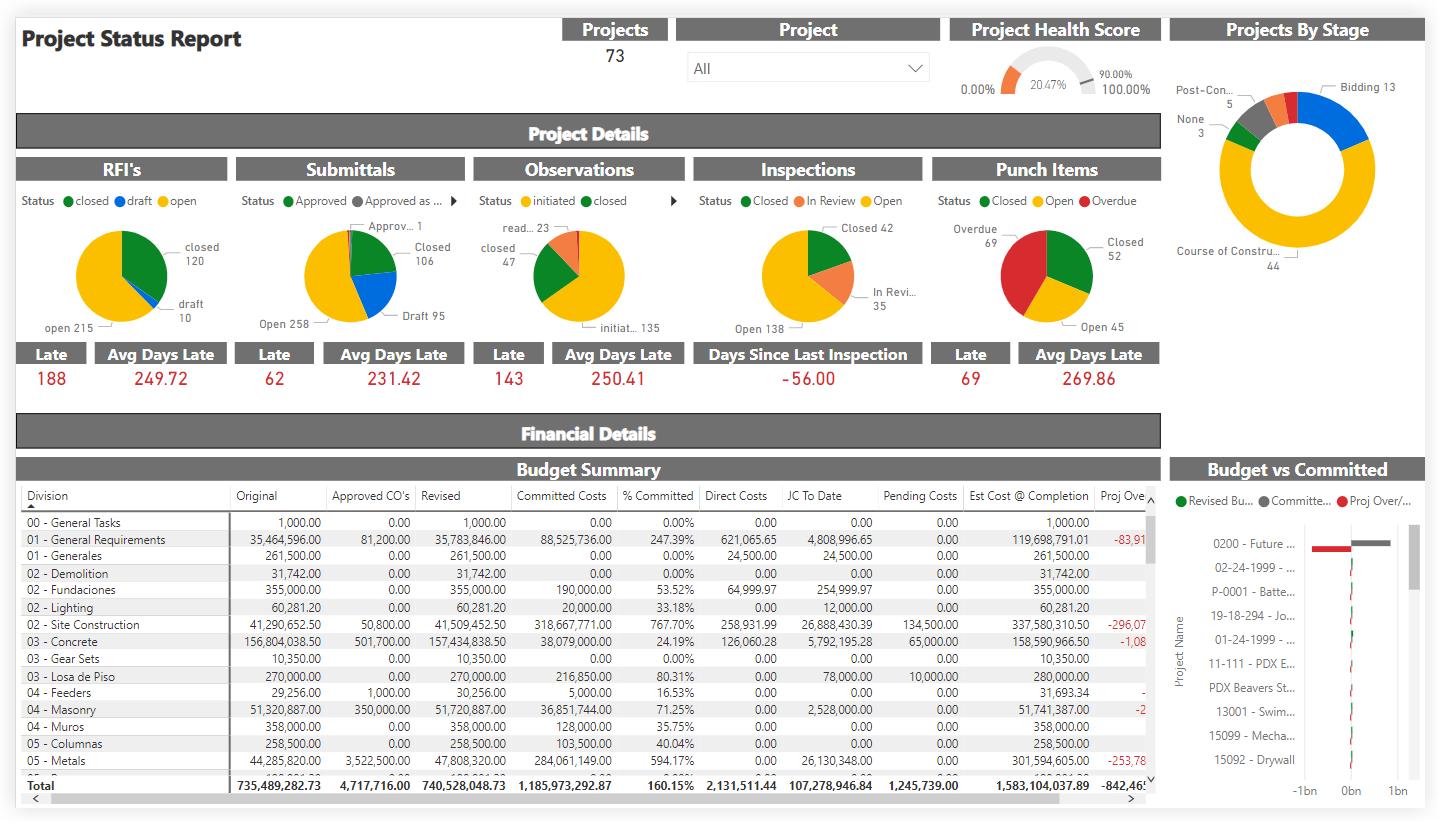
Project Status Report
Project Tool Utilization
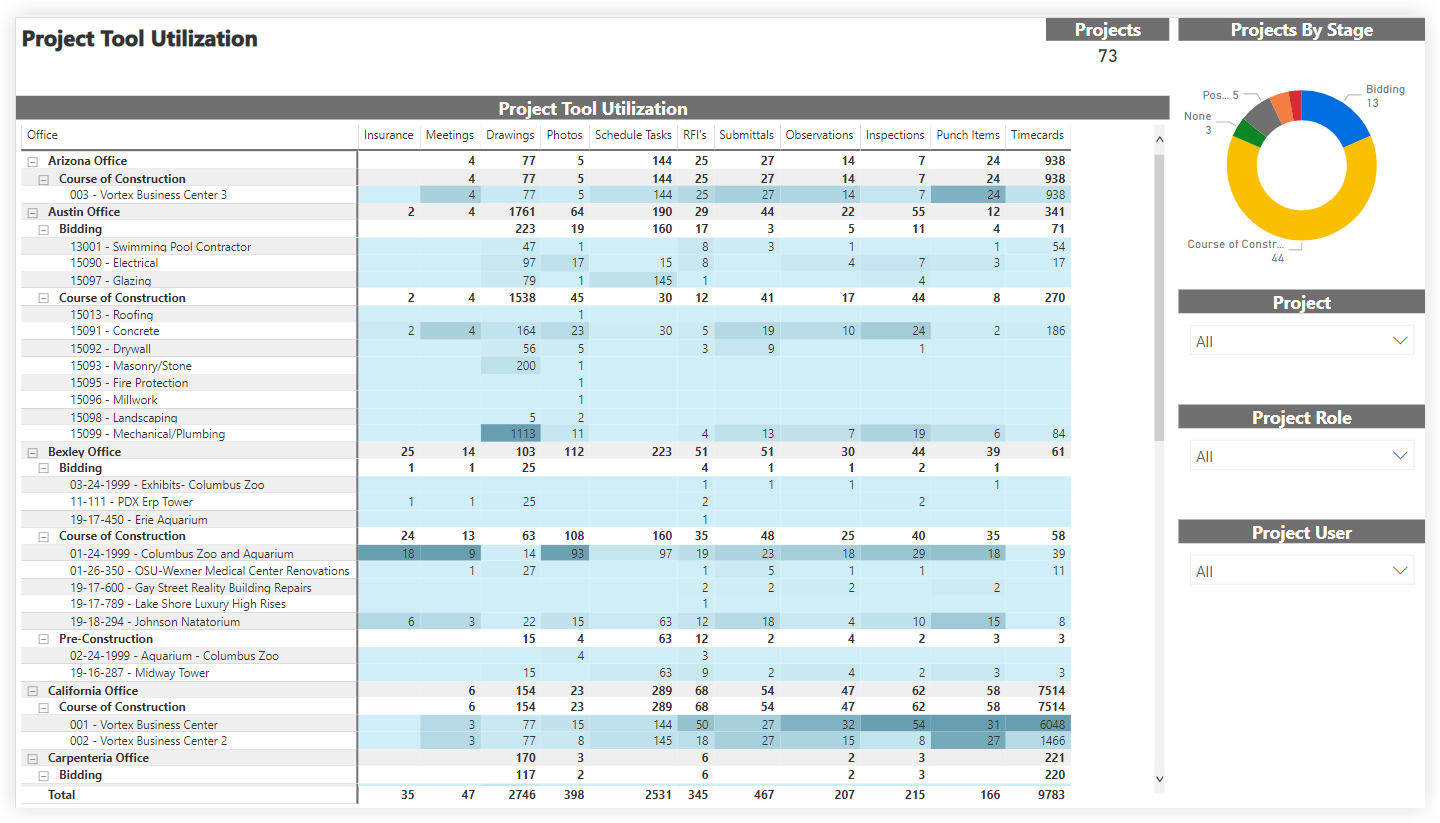
The Project Tool Utilization report includes a summary of your company's Projects By Stage, with a count of the project(s) in each stage of construction. By applying the Project, Project Role, and Project User filters, you can include all available data or narrow the data plotted.
The Project Tool Utilization table groups your WBS cost code segment data by office location. See Add an Office Location and Assign an Office Location to a Project.
Tips
Why is there no 'Division' concept in Procore? In Procore's WBS, the 'Cost Code' segment is a tiered segment and there is no concept of 'Division'. Instead, a 'Division' is treated as a tier in a tiered segment. Tiers within a segment are always delimited by a dash (-). Procore's default cost code list has two (2) tiers. However, your environment might have one, two, or multiple tiers. To learn more, see Work Breakdown Structure FAQ.
Can I get a copy of the default cost code list? To download a copy of the default cost code names for your reference, click Procore_Default_Cost_Codes.csv.
Note: This CSV file is for reference only and not formatted for imports into Procore.
The columns in the Project Tool Utilization table provide counts and a color-coded heat map to show the number of items created.
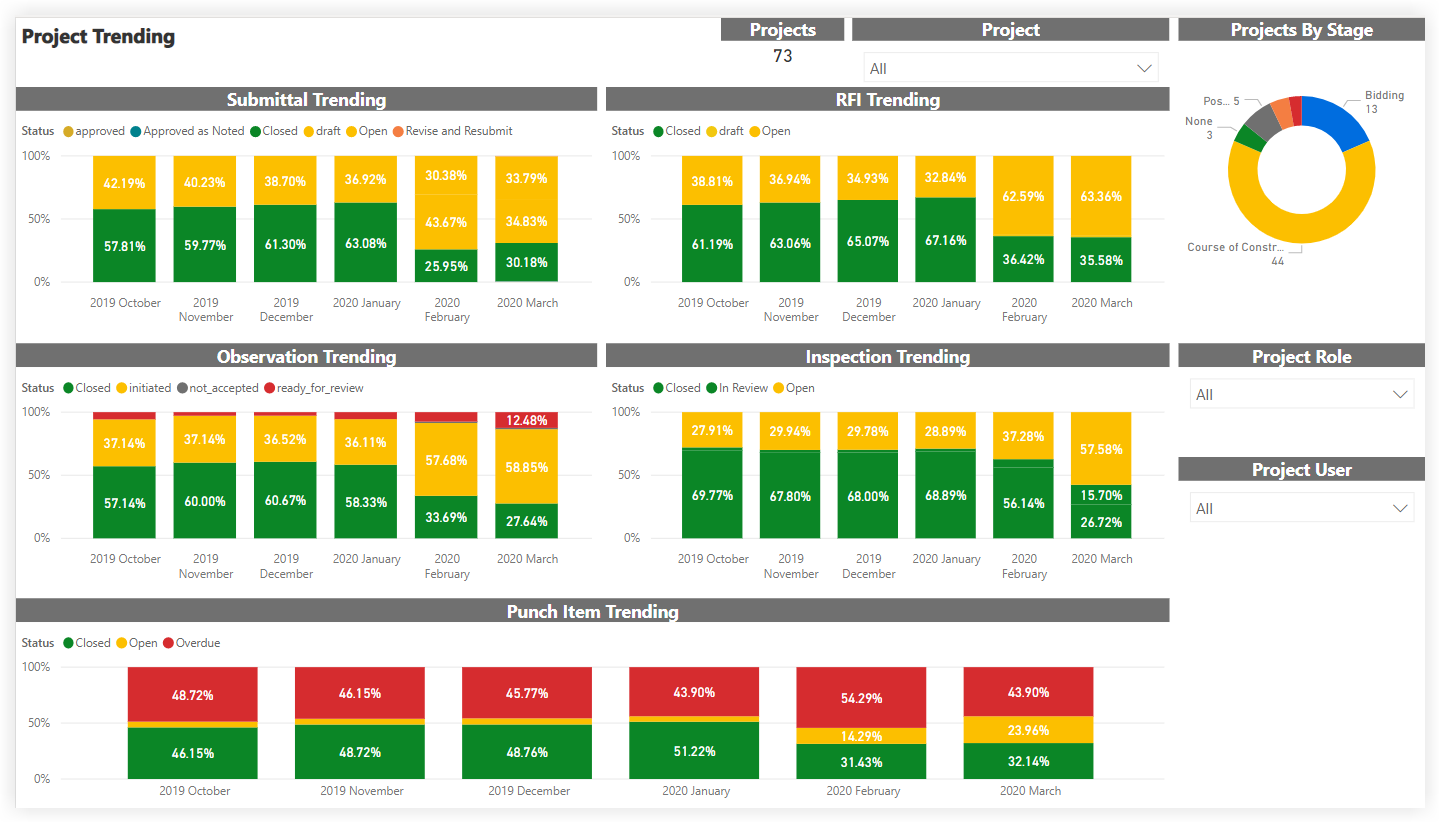
Project Trending
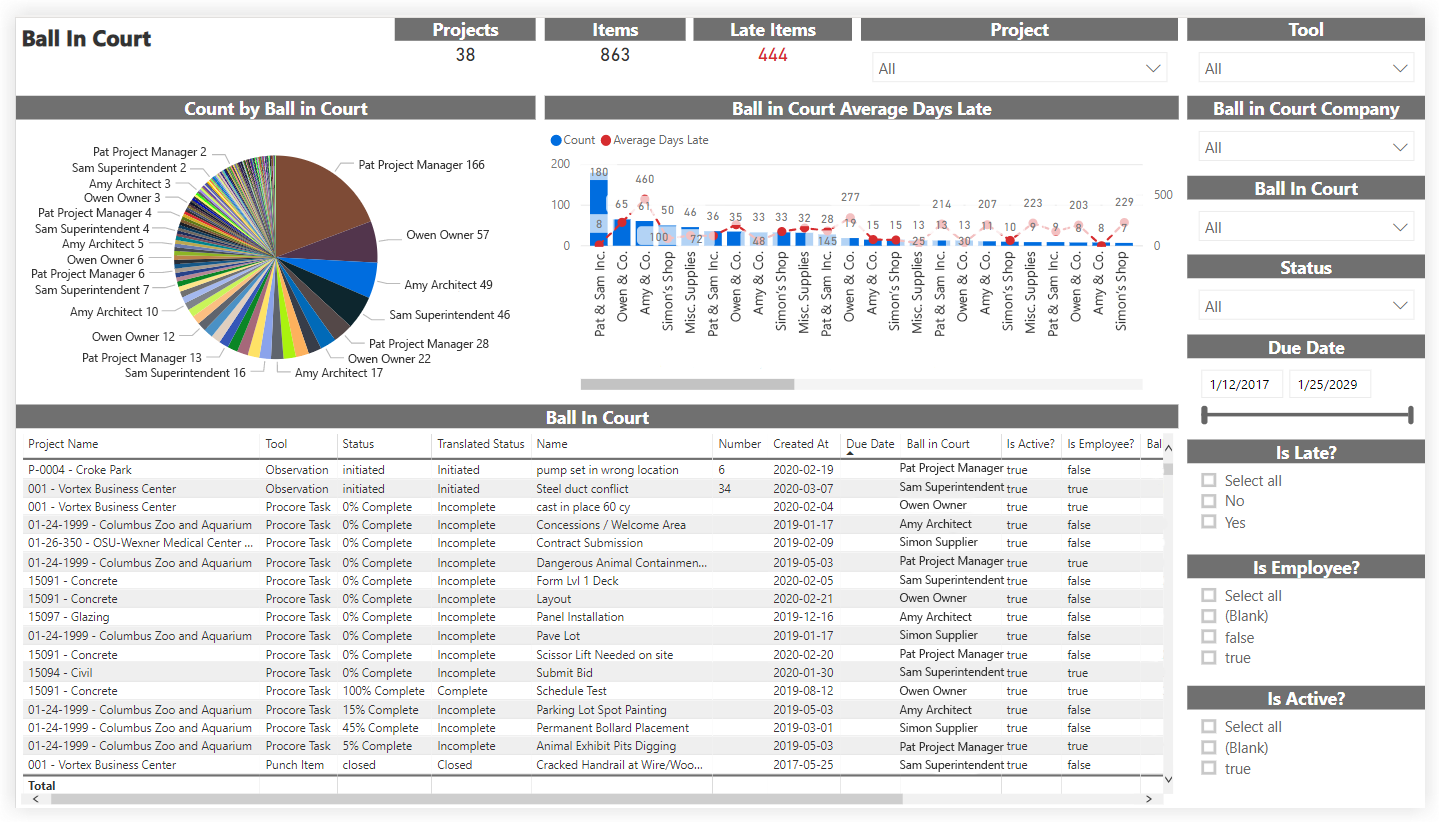
Ball in Court
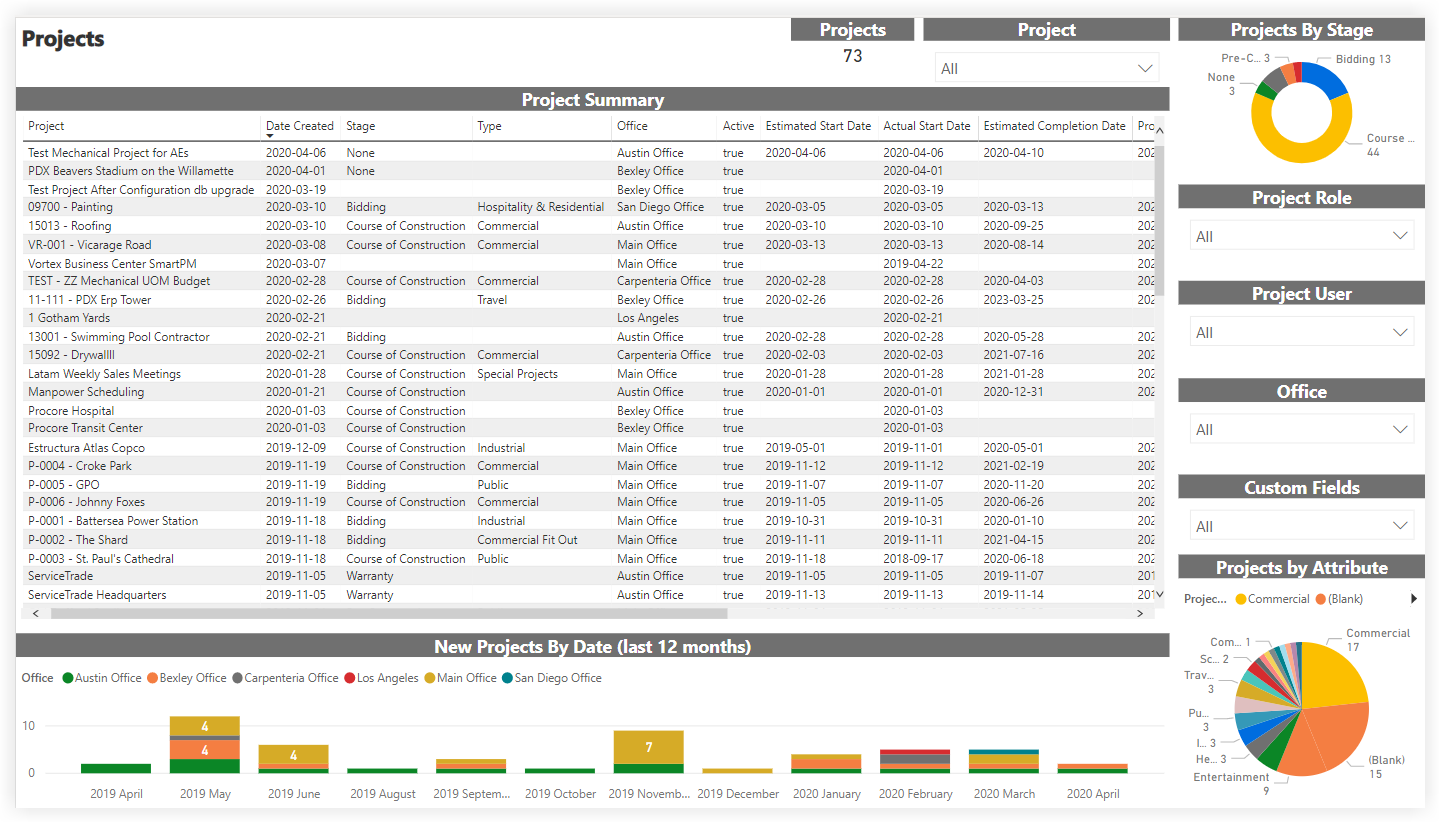
Projects
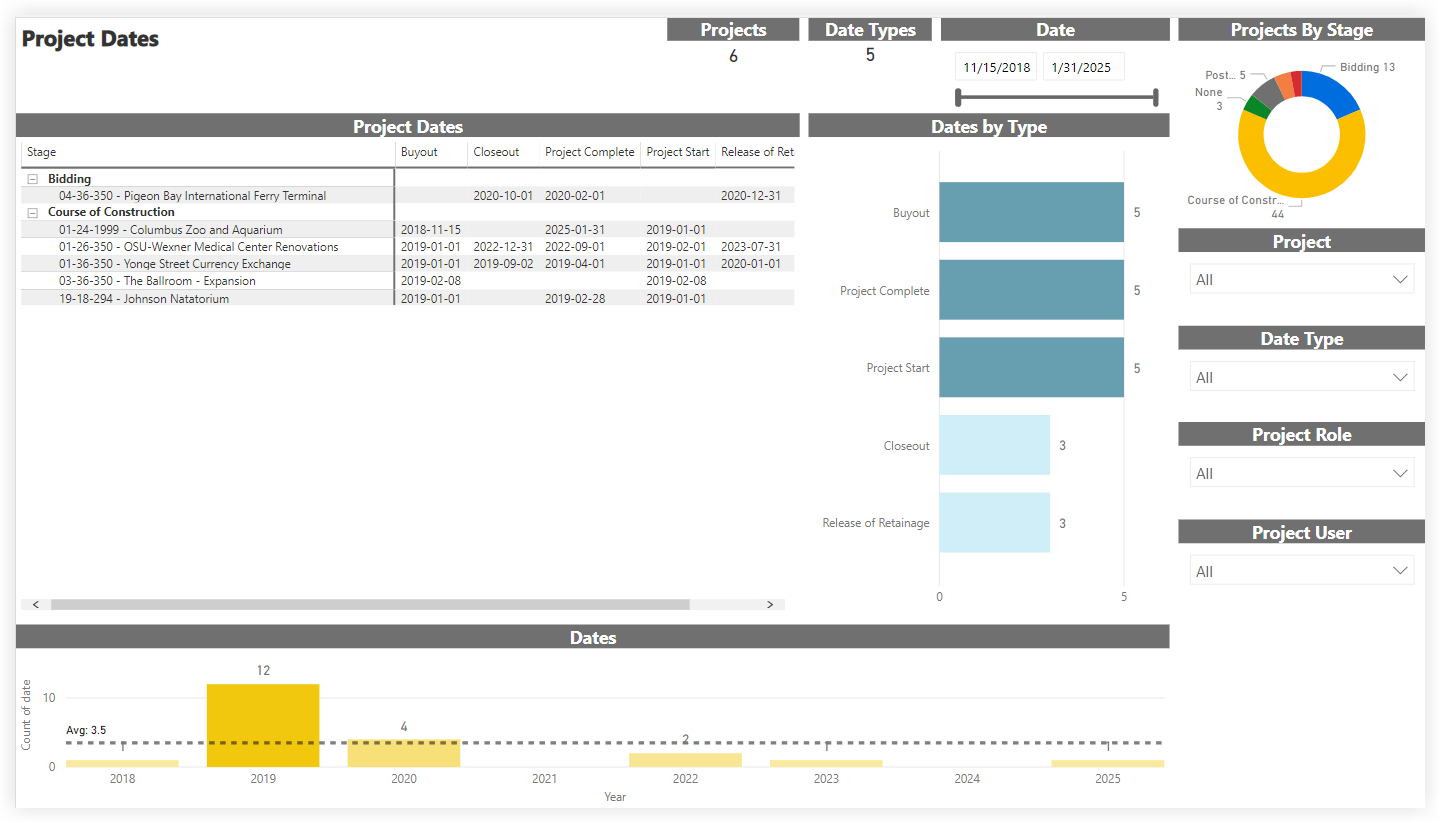
Project Dates
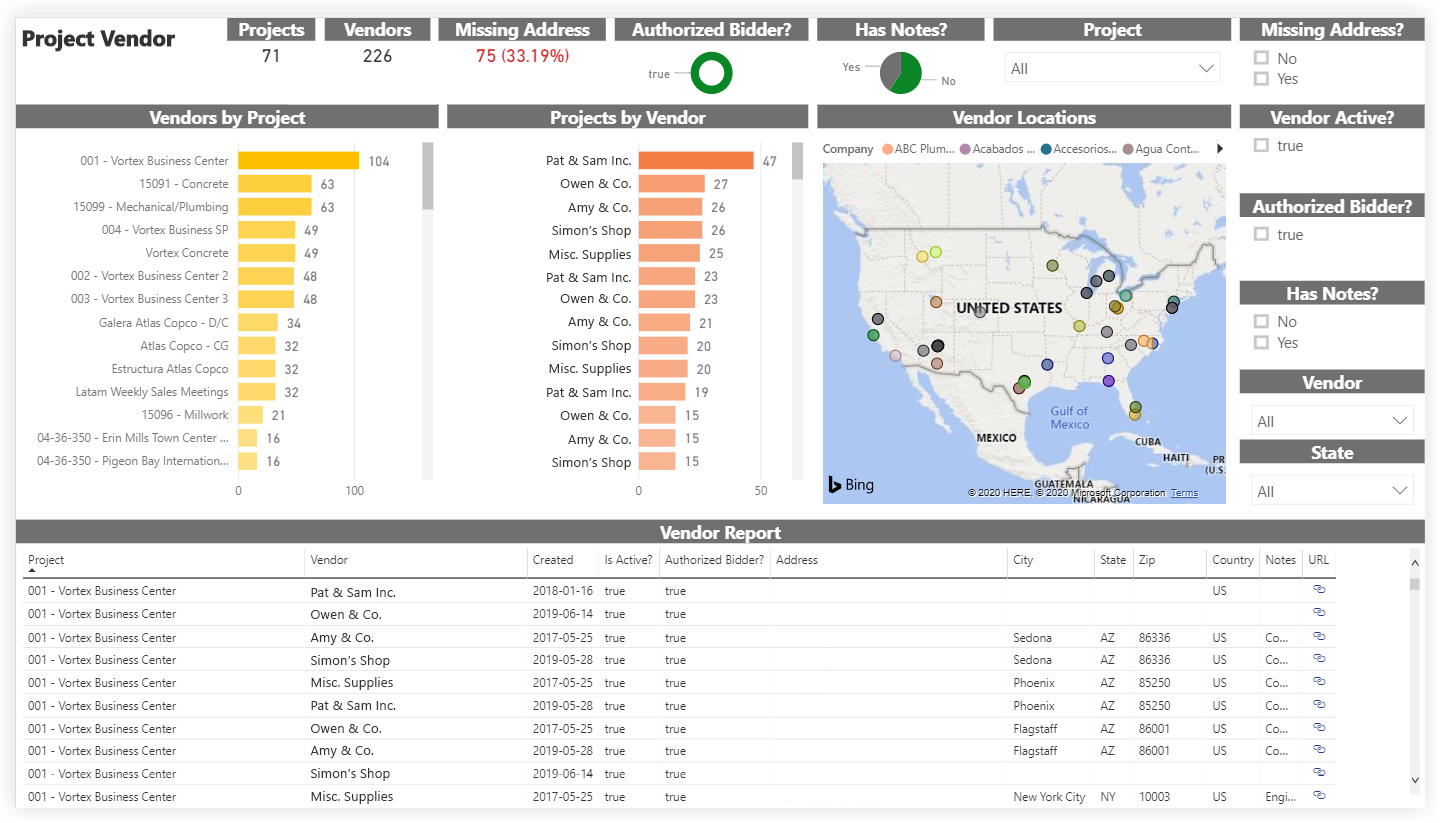
Project Vendor
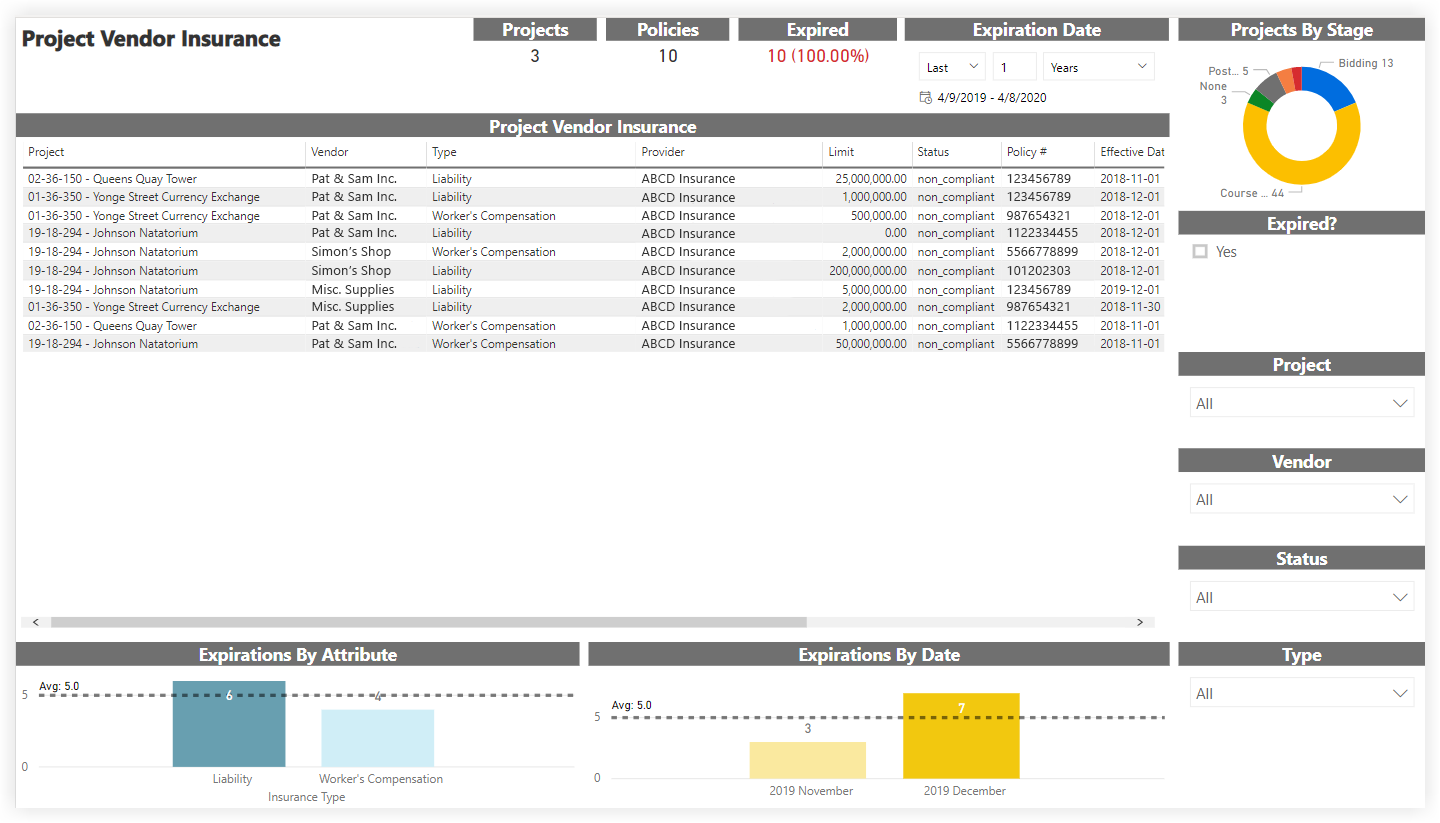
Project Vendor Insurance
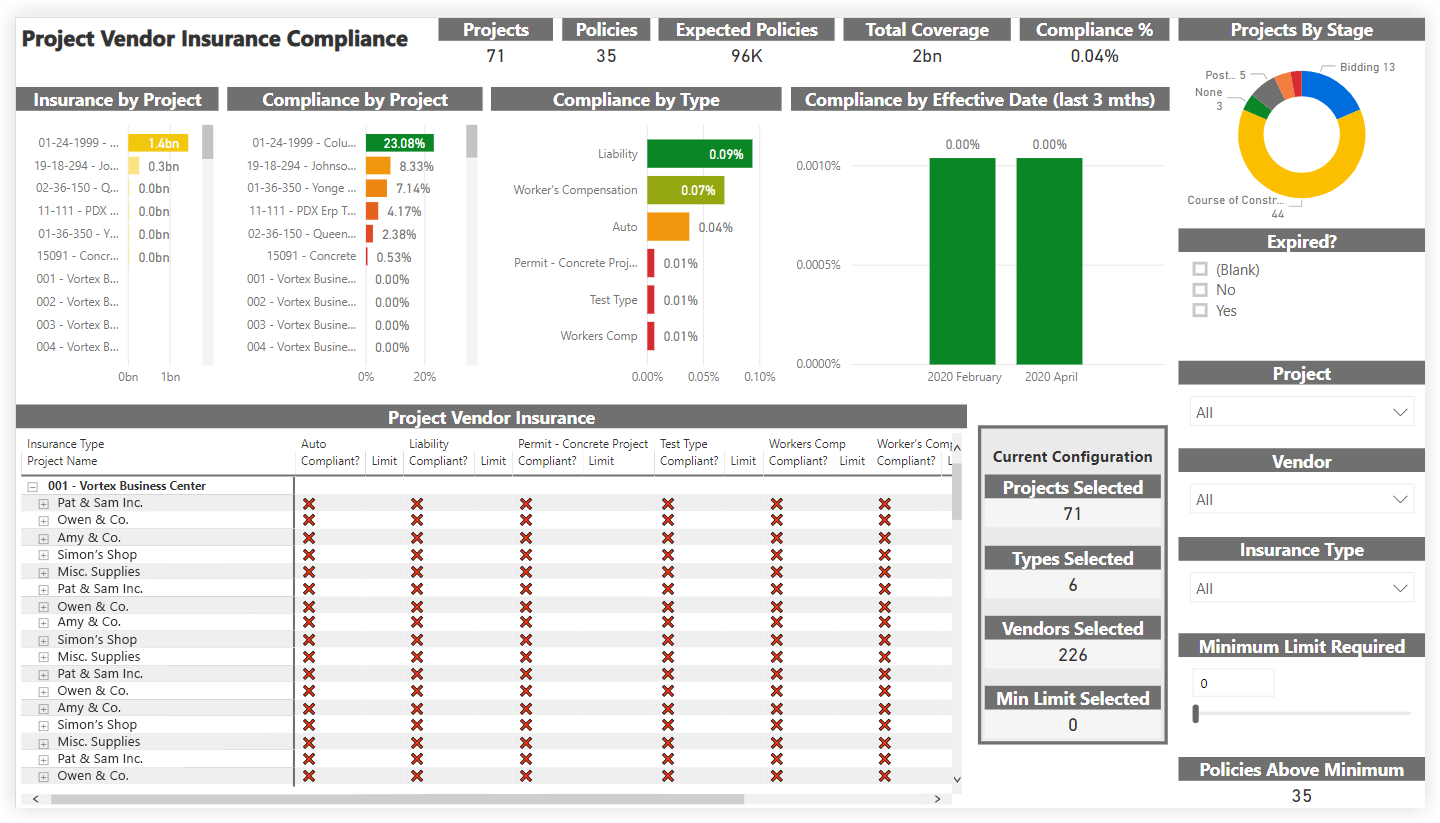
Project Vendor Insurance Compliance
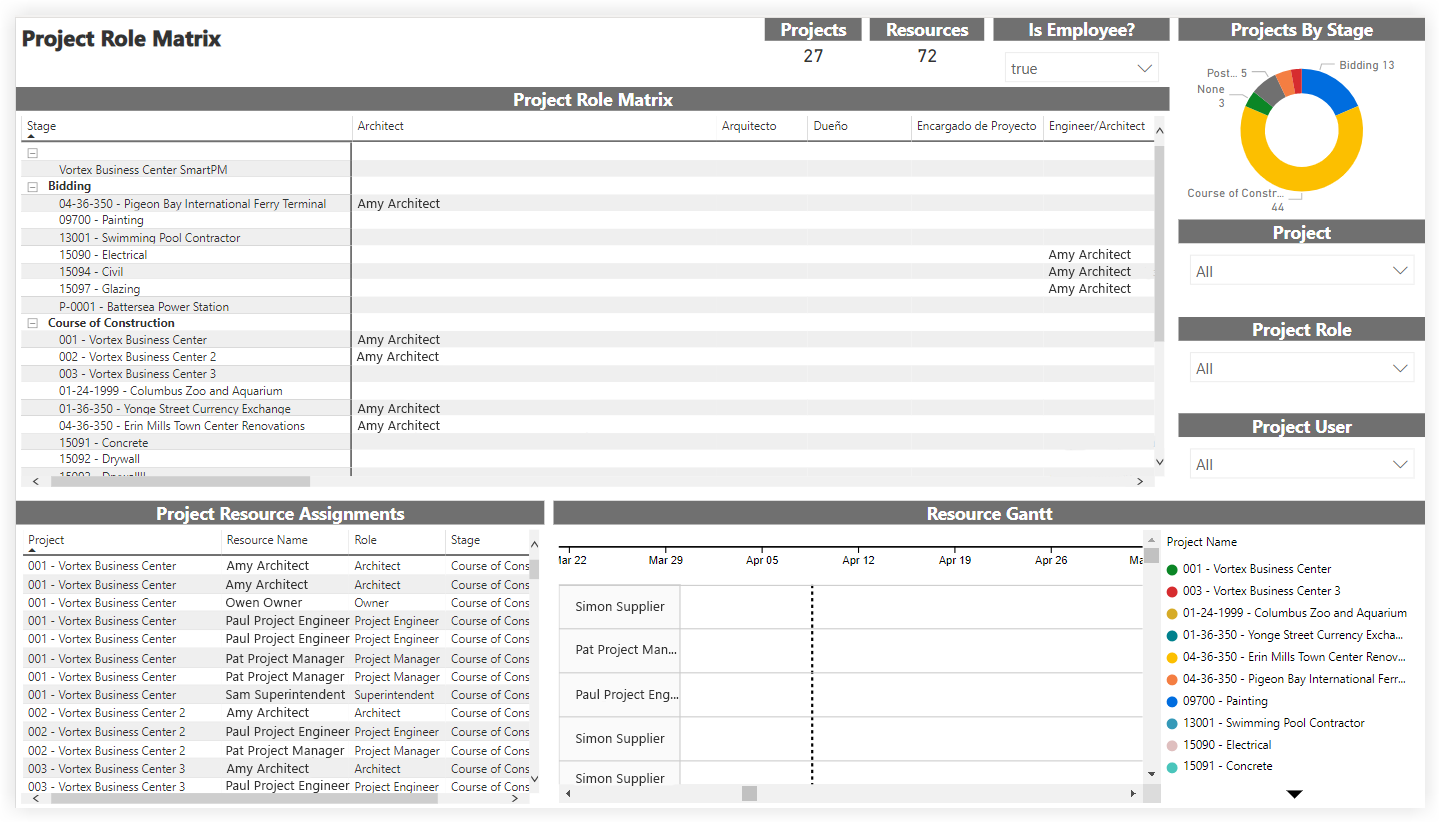
Project Role Matrix
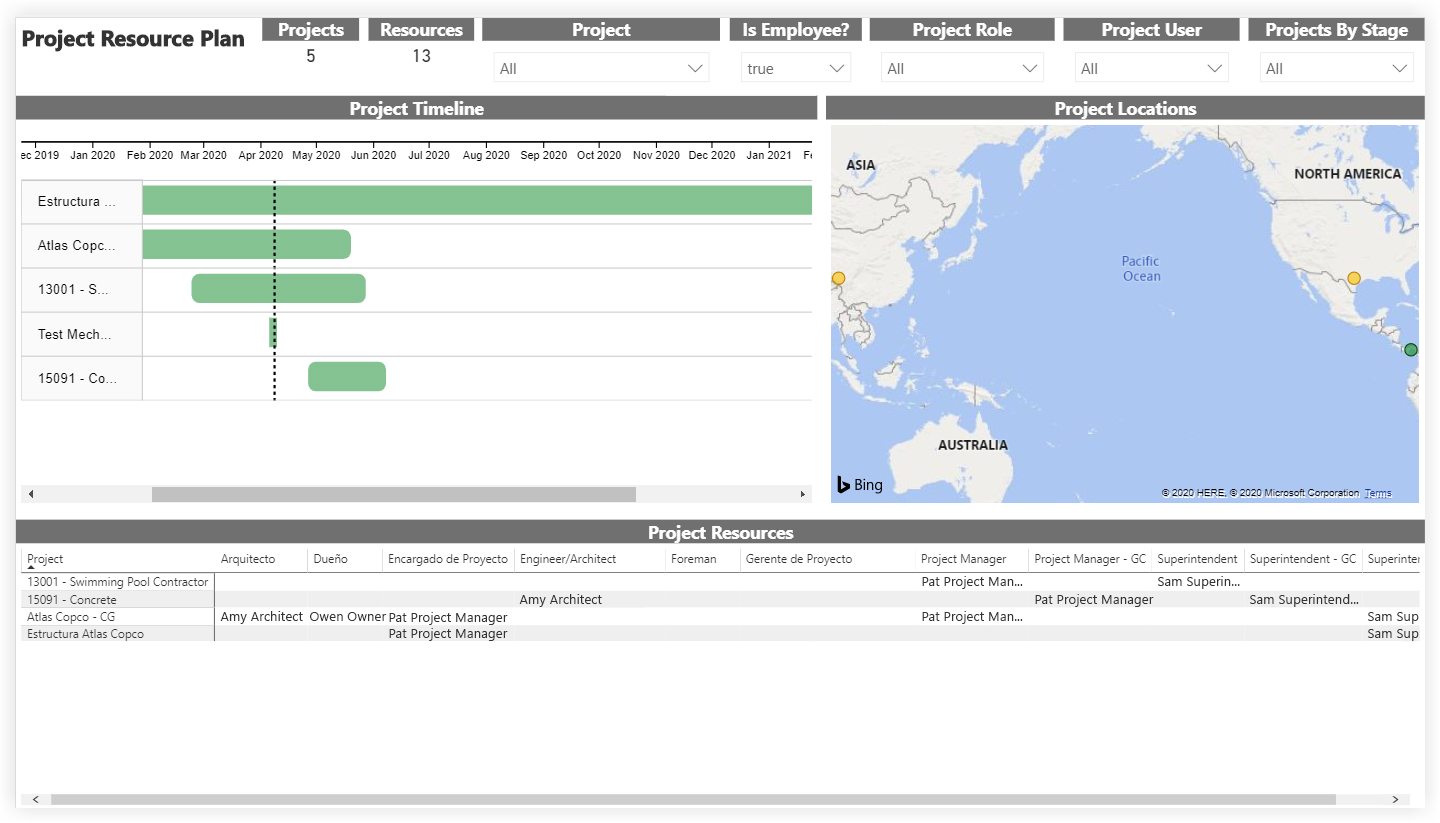
Project Resource Plan
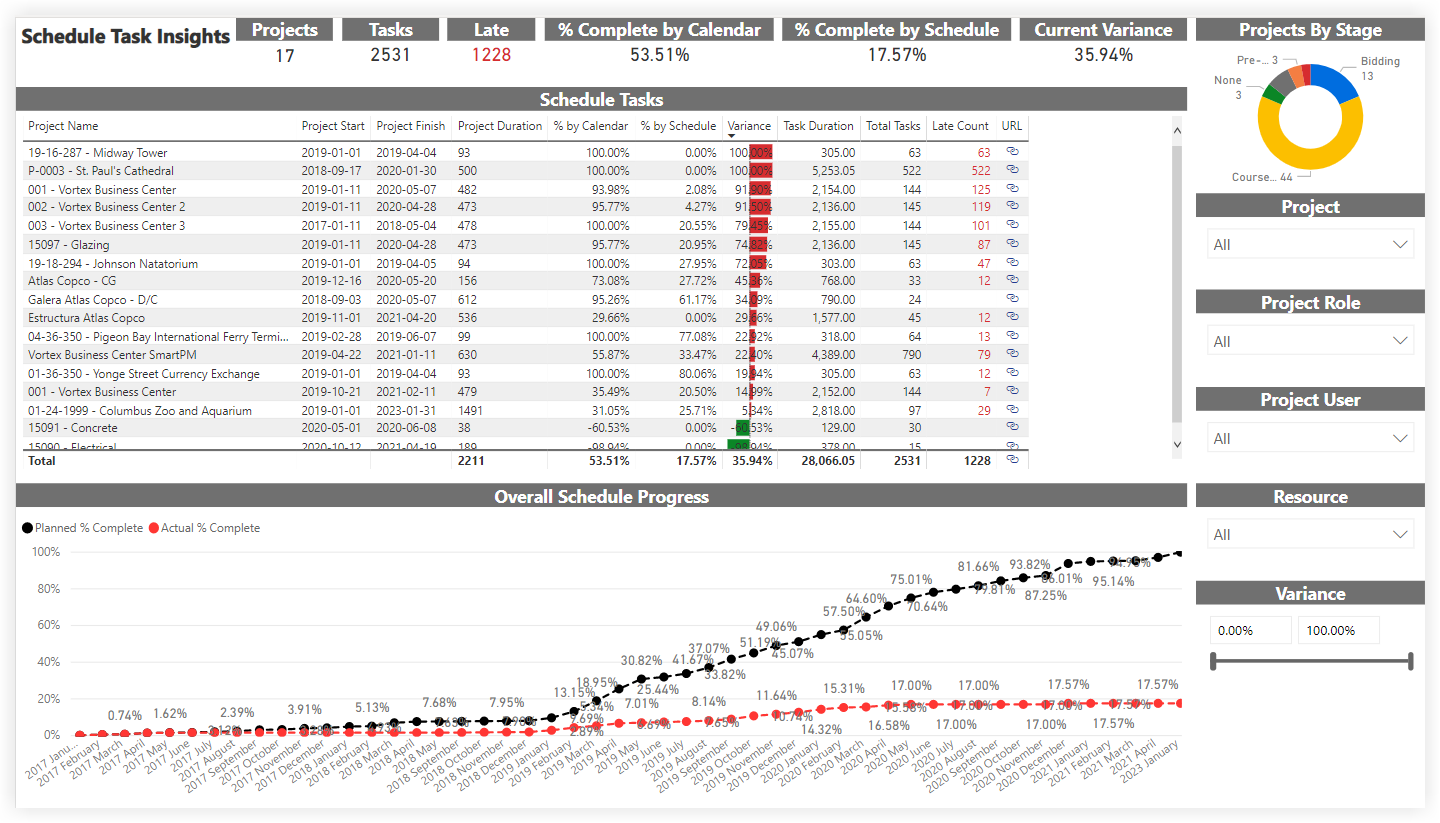
Schedule Task Insights
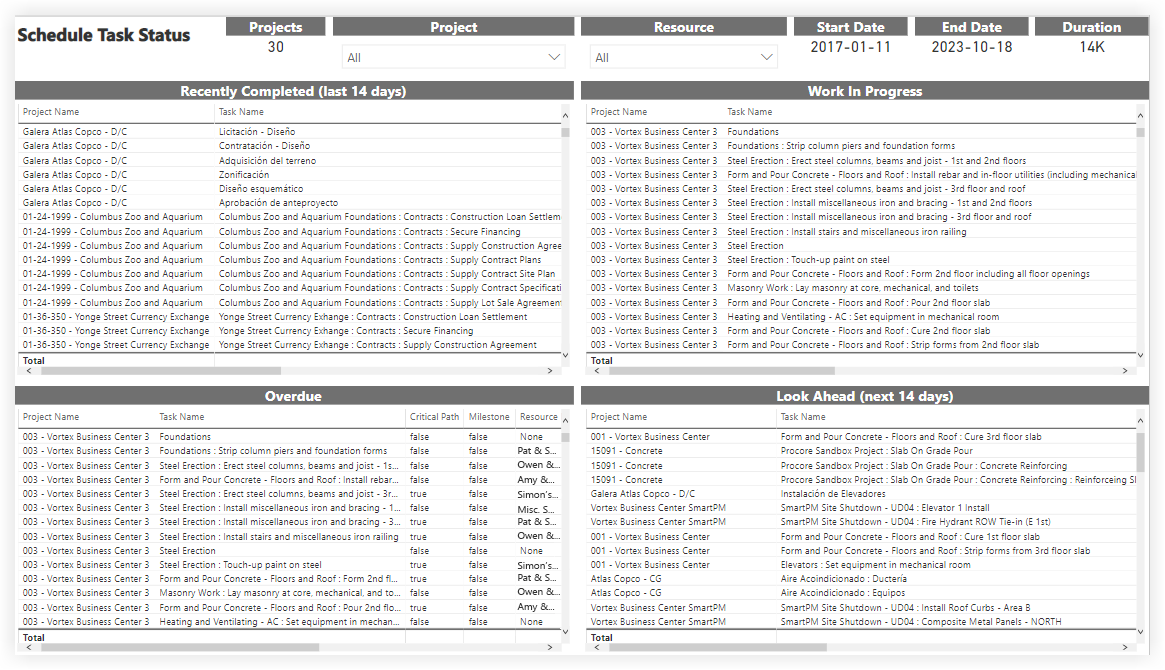
Schedule Task Status
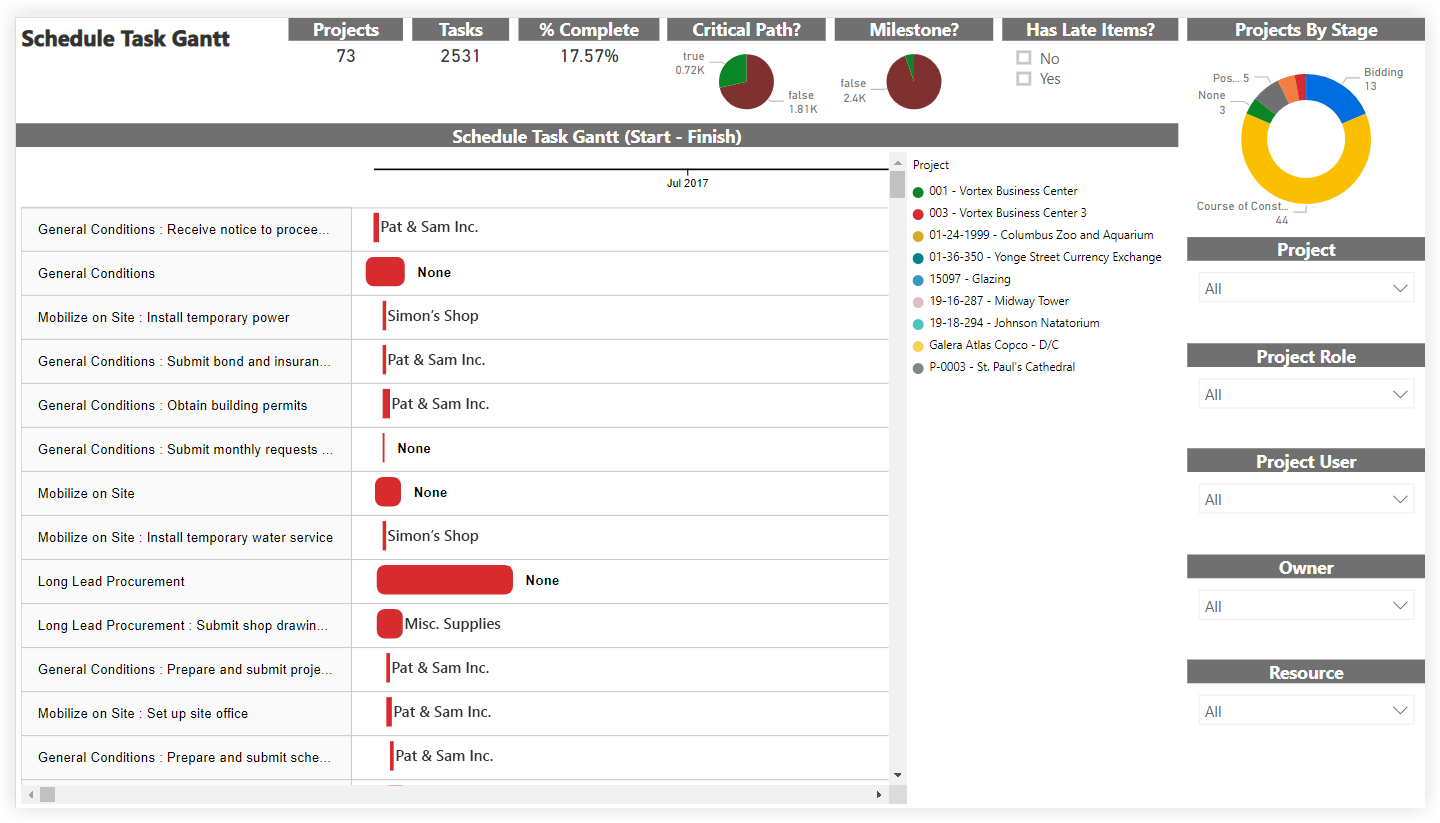
Schedule Task Gantt
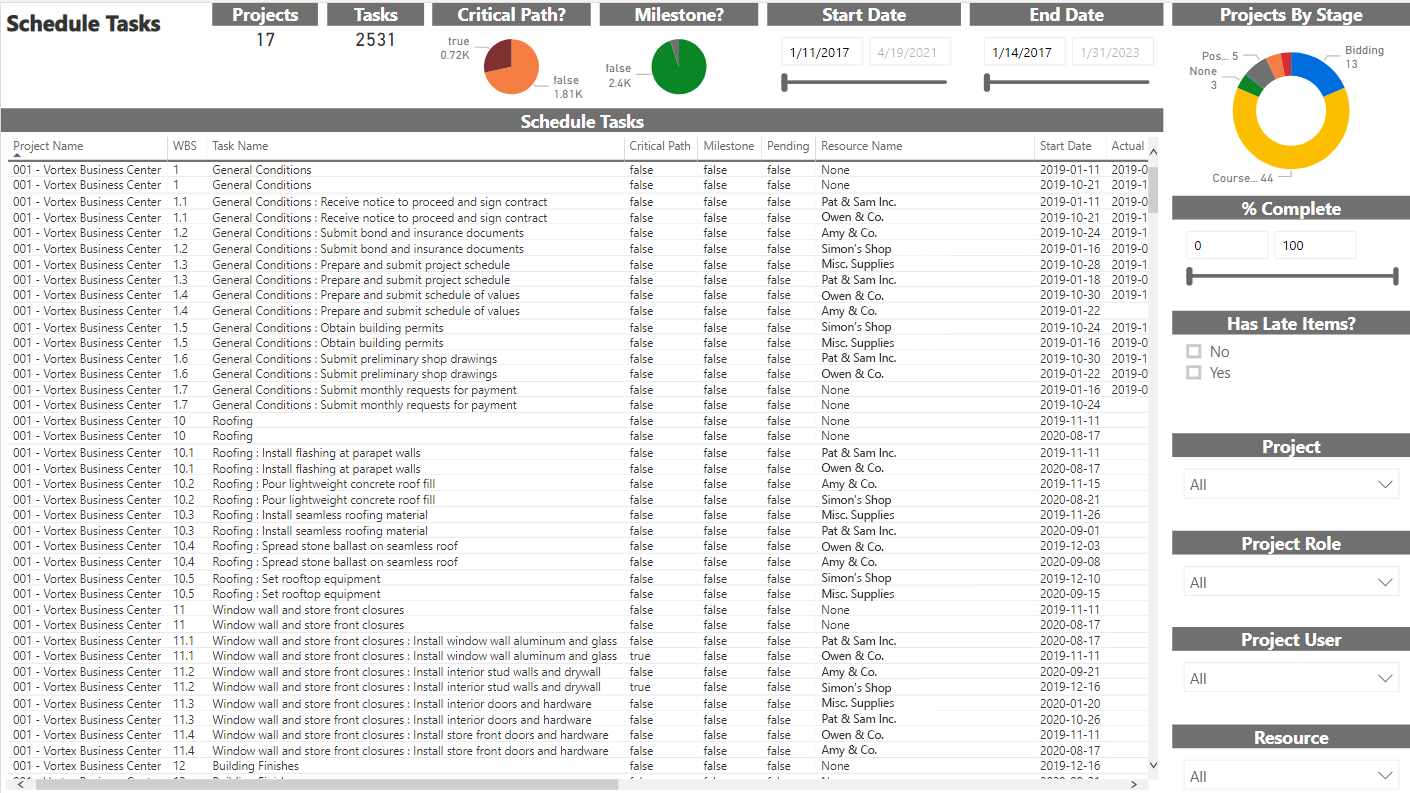
Schedule Tasks
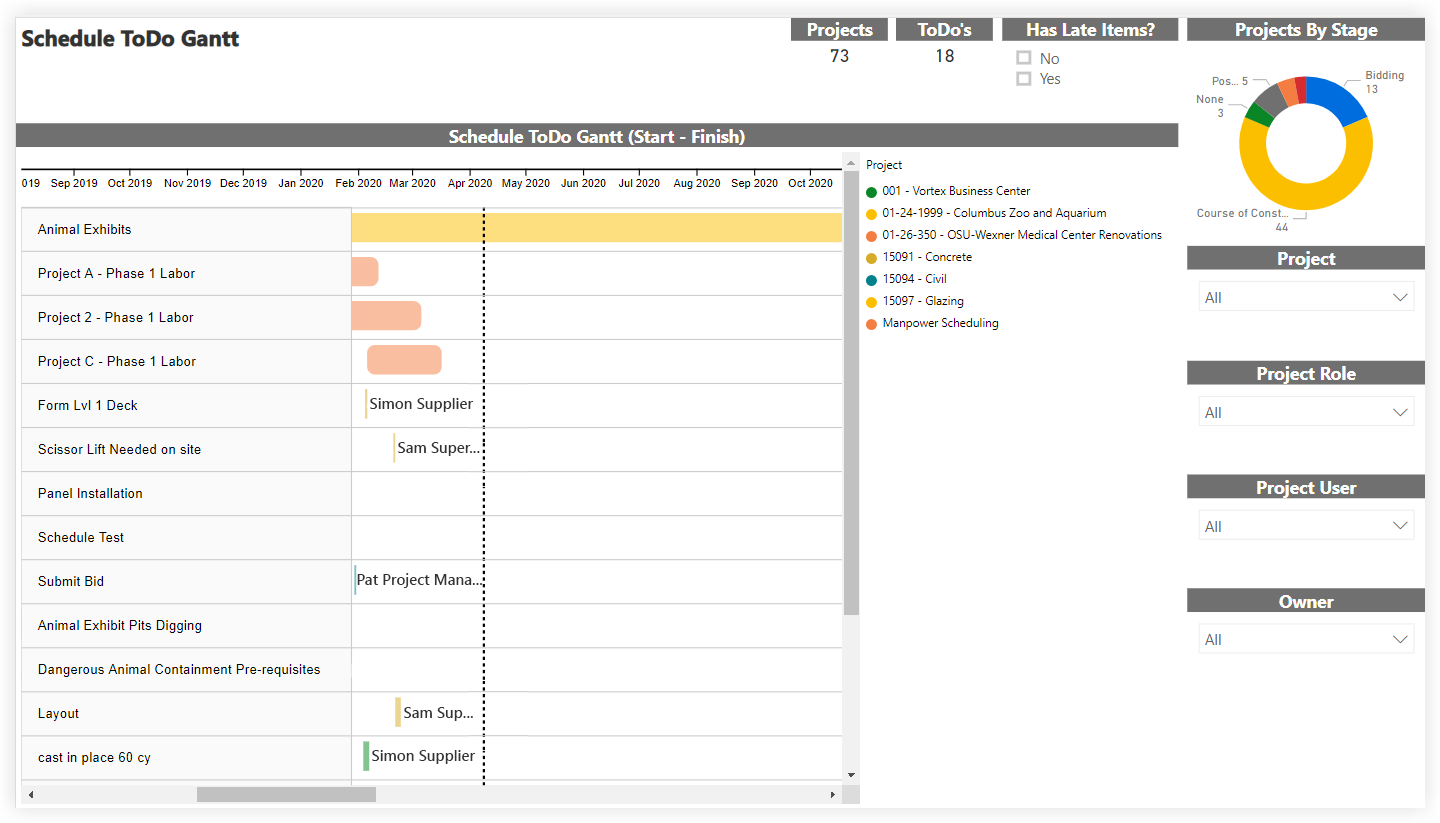
Schedule ToDo Gantt
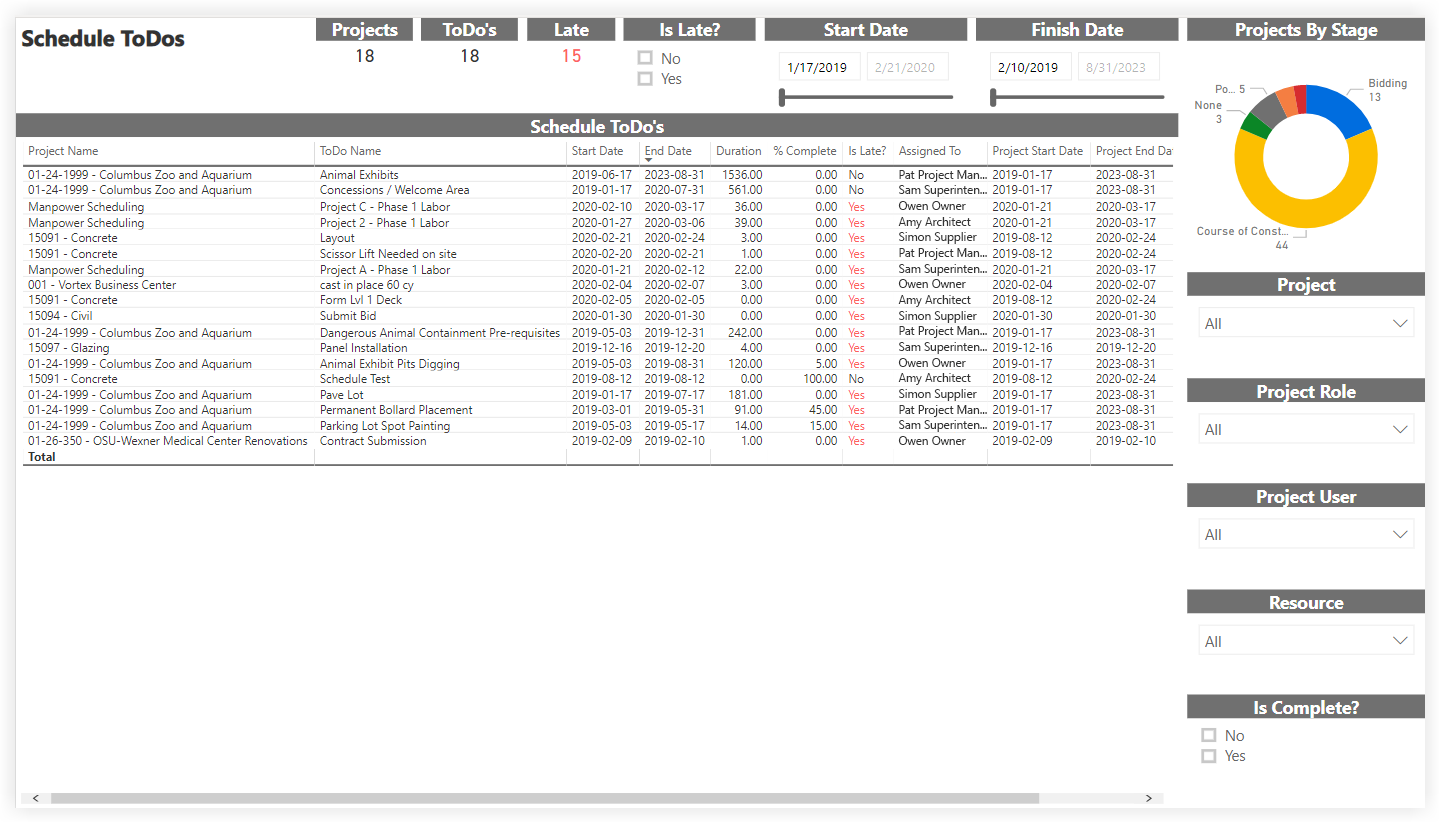
Schedule ToDos
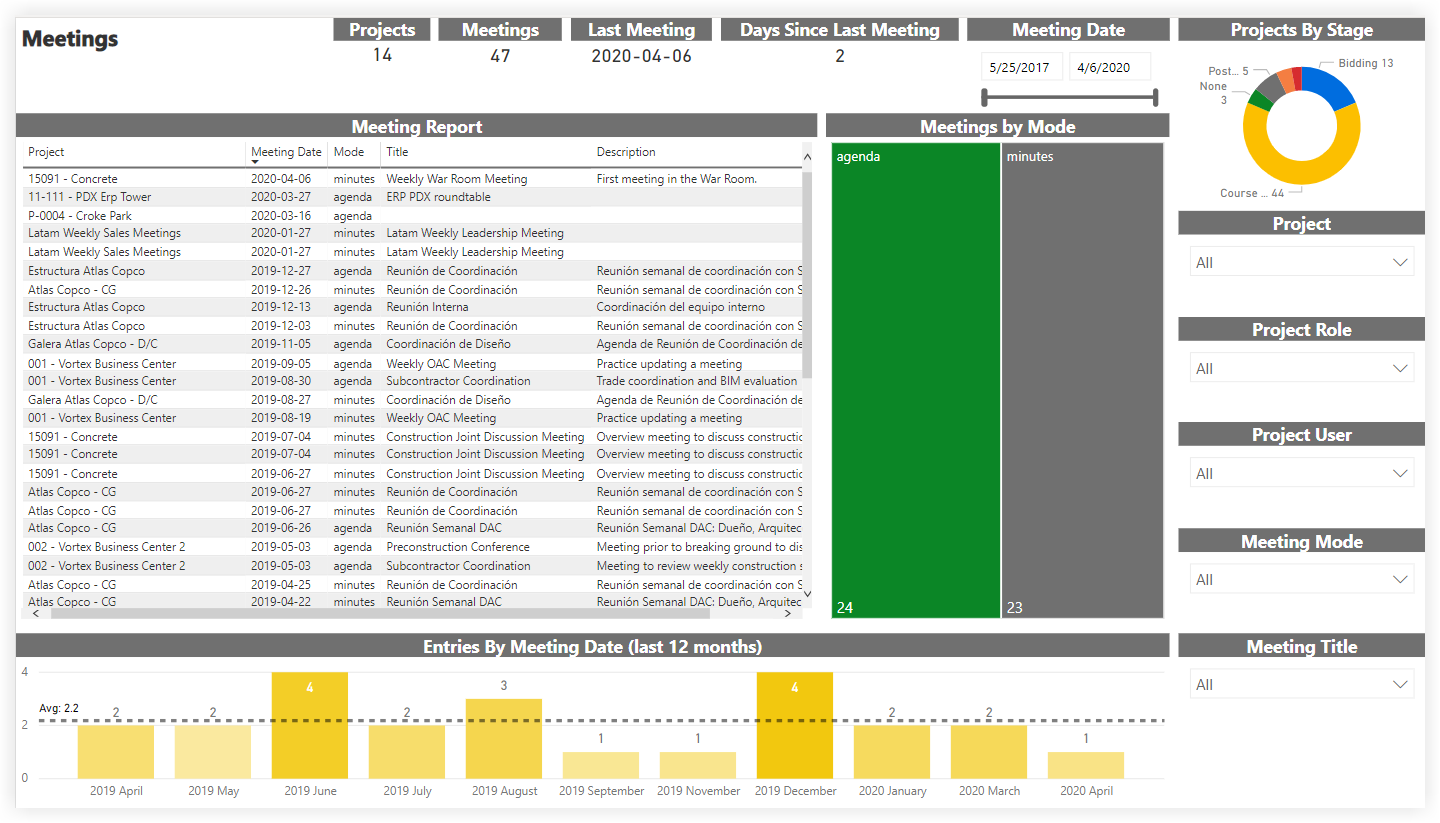
Meetings
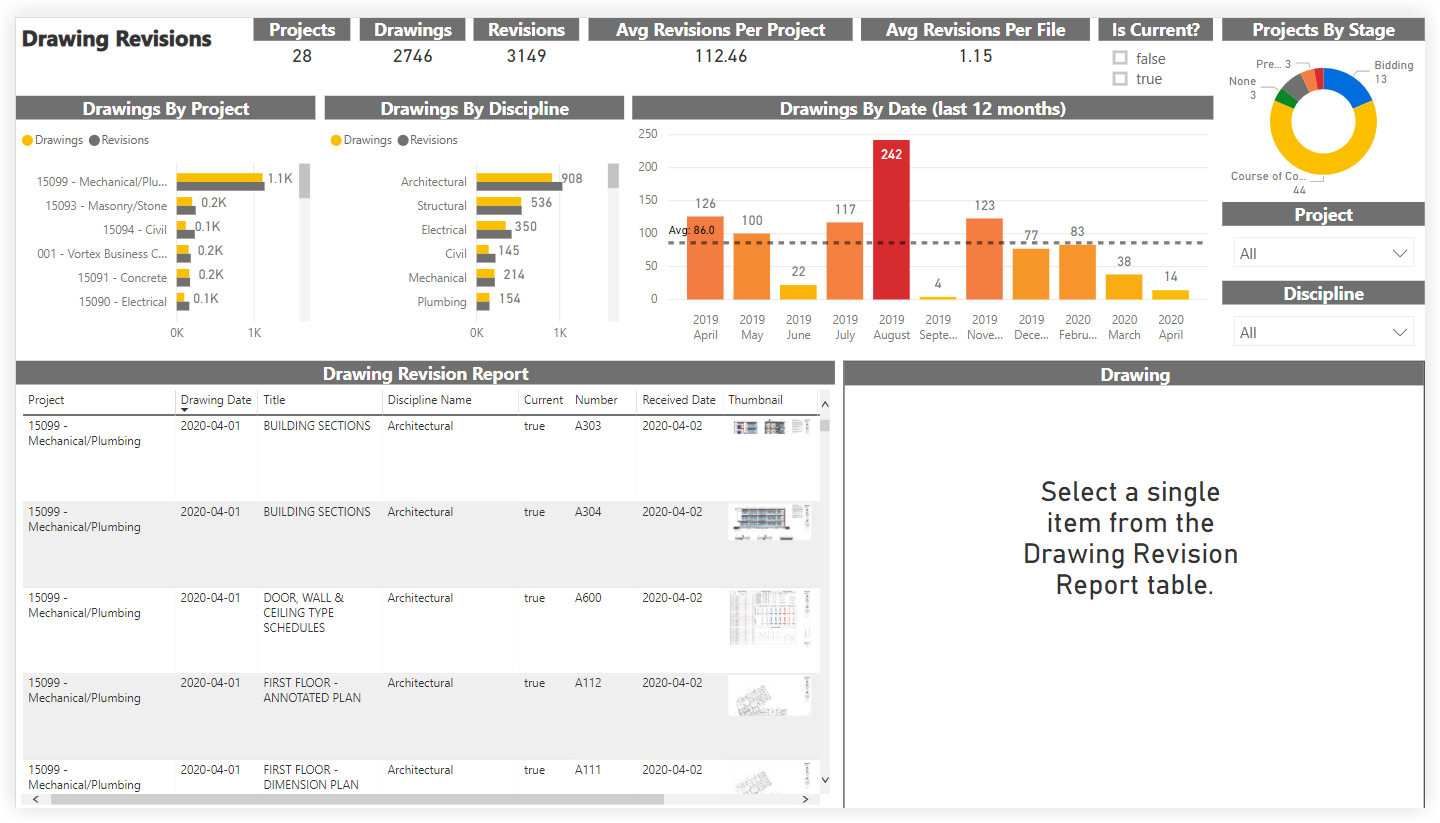
Drawing Revisions
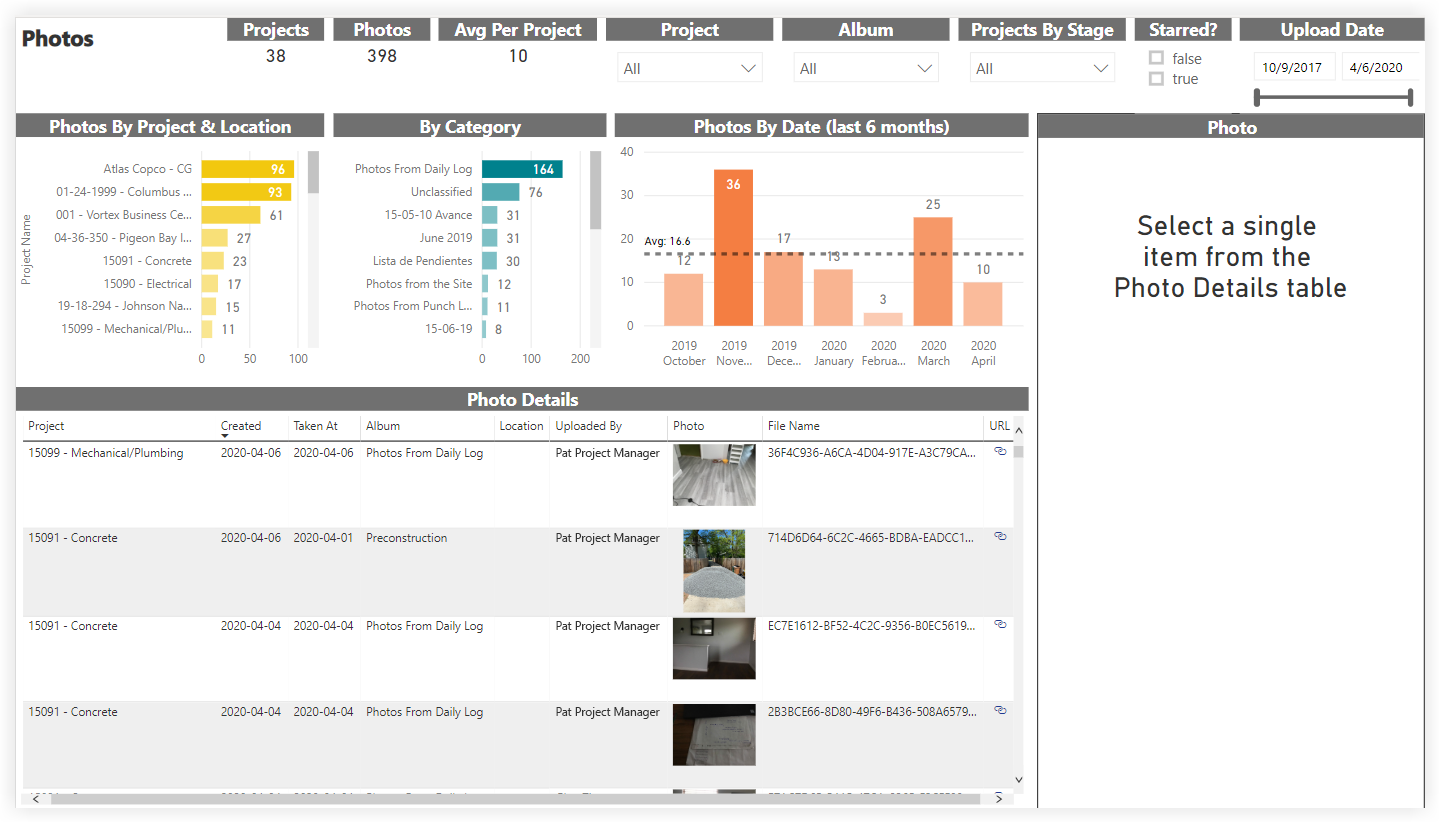
Photos
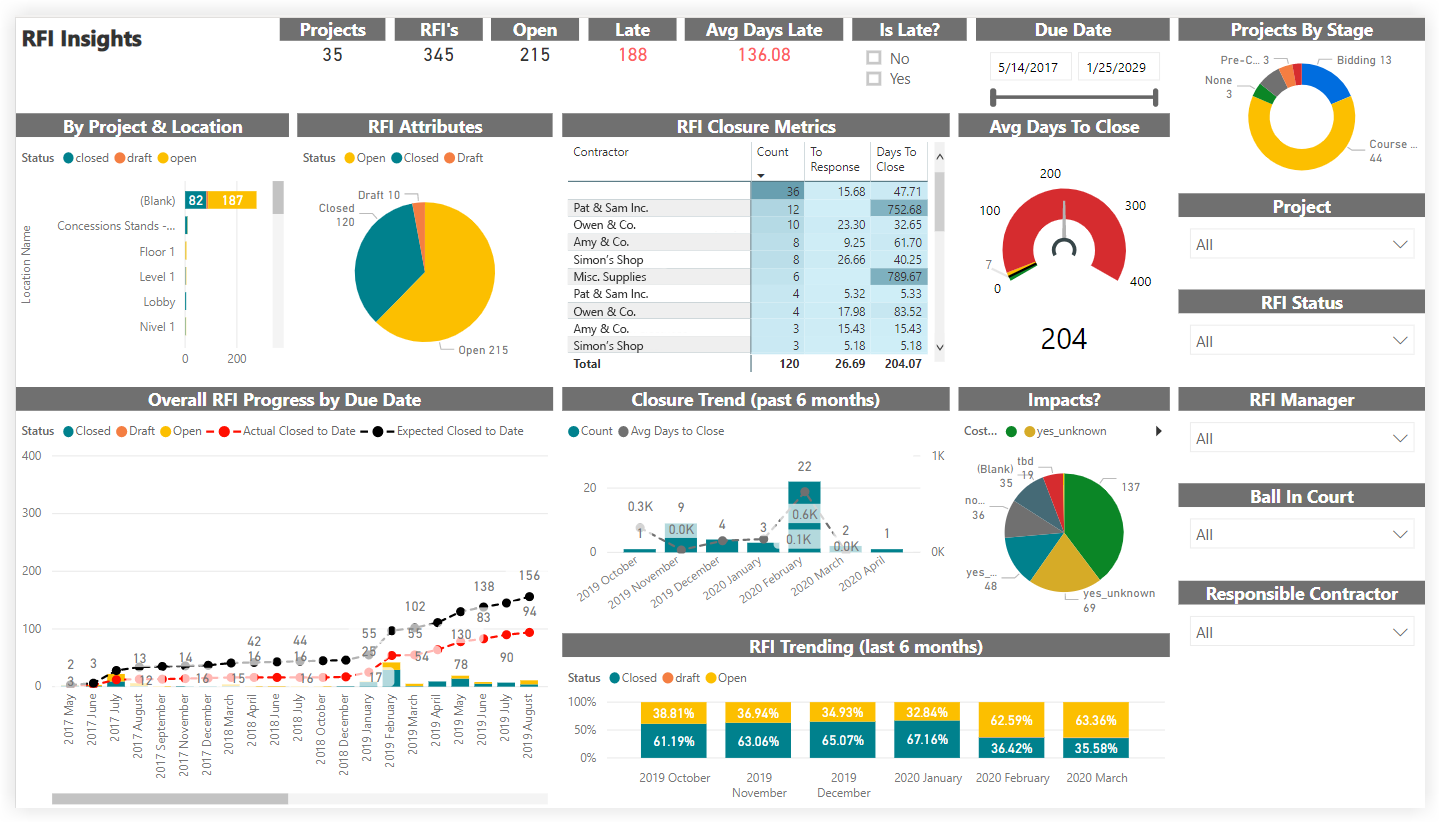
RFI Insights
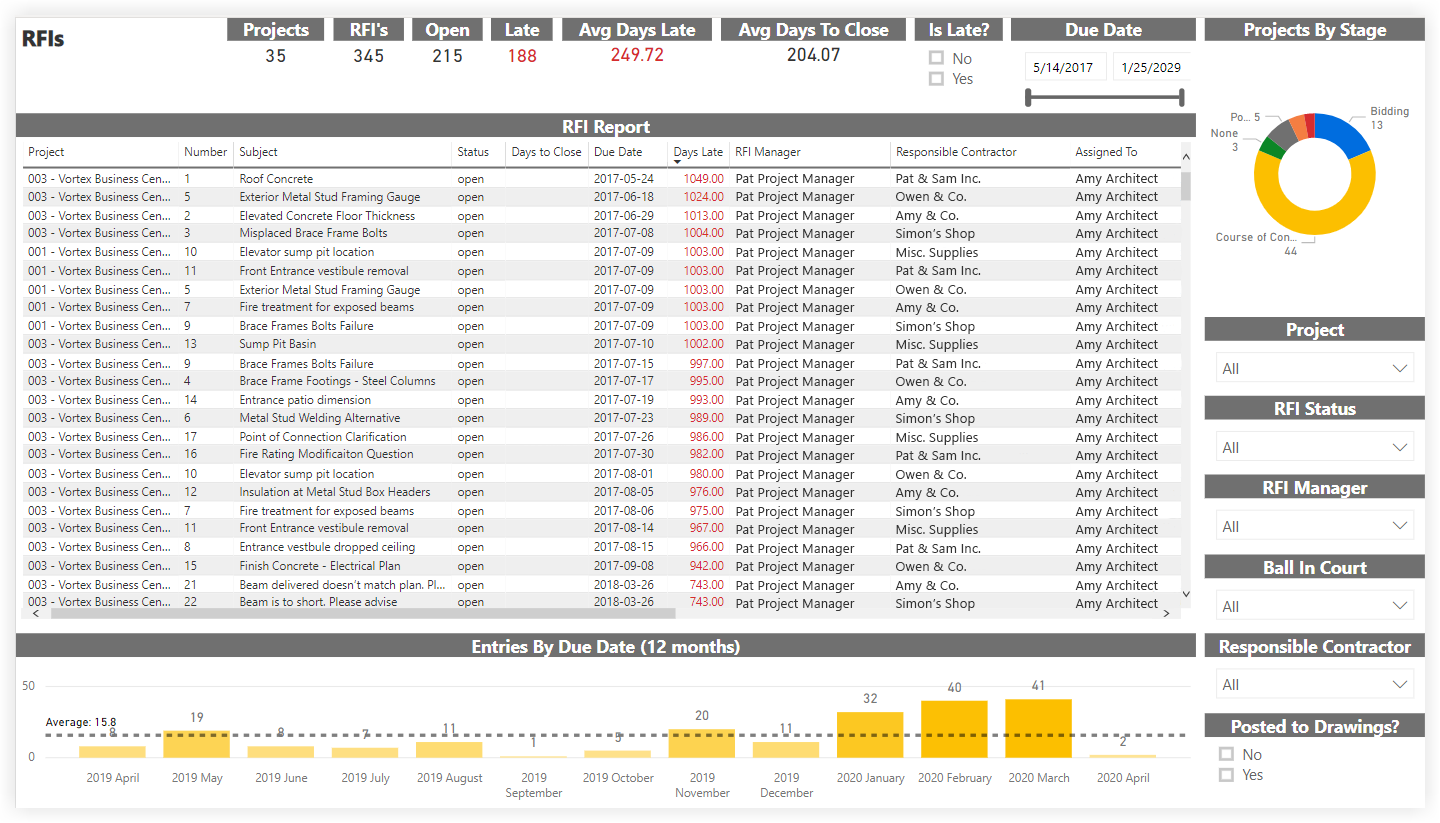
RFIs
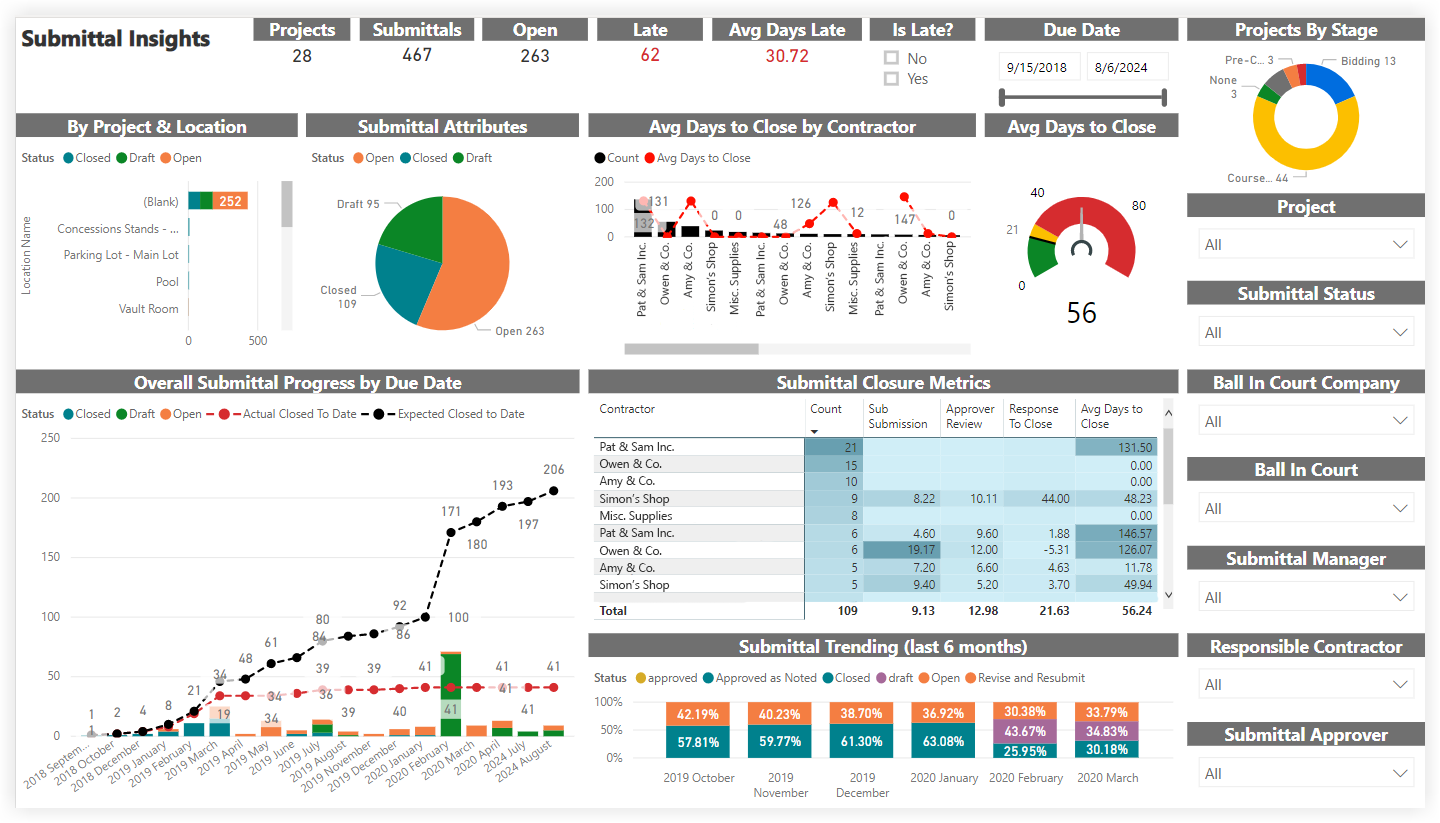
Submittal Insights
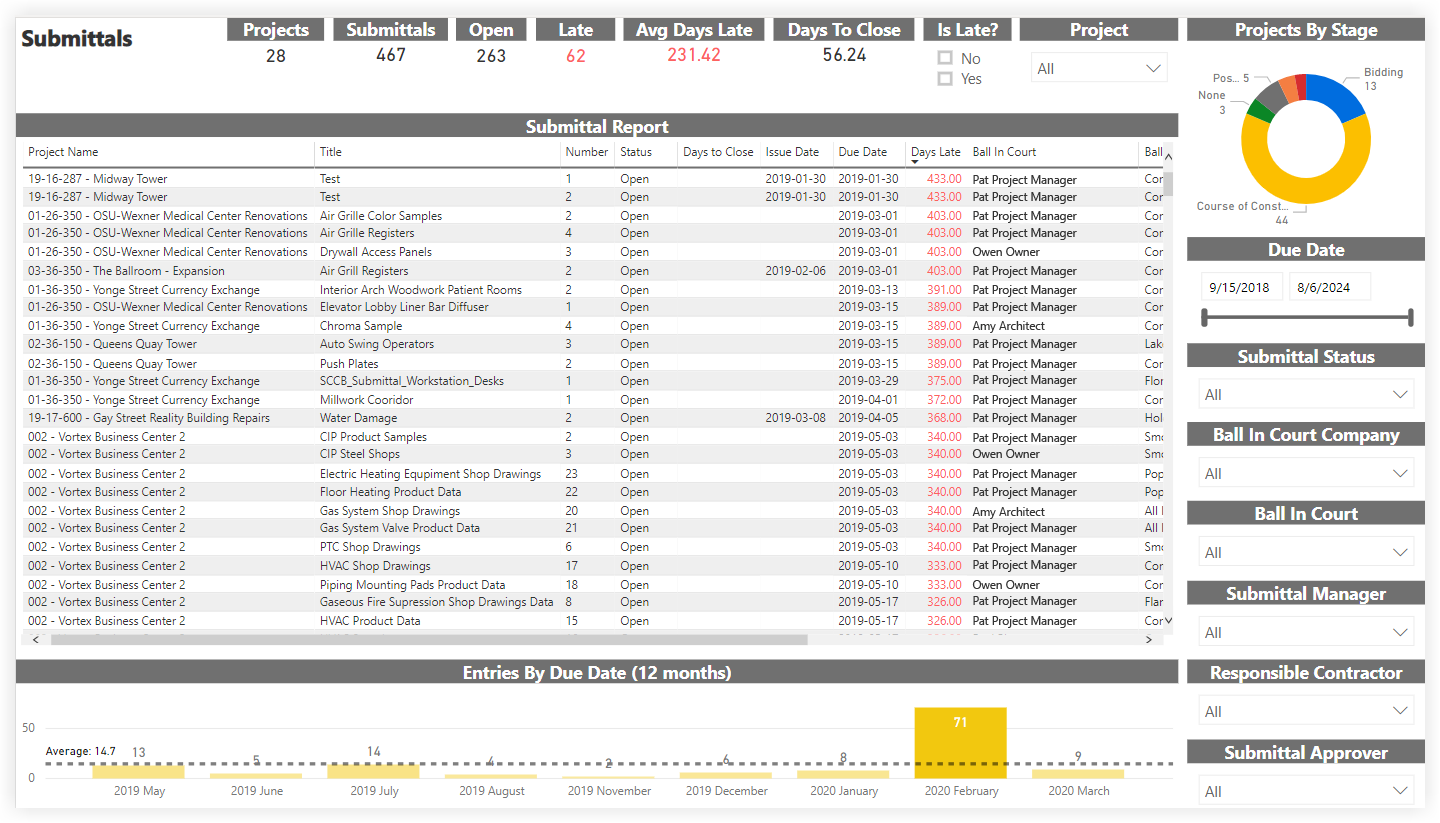
Submittals
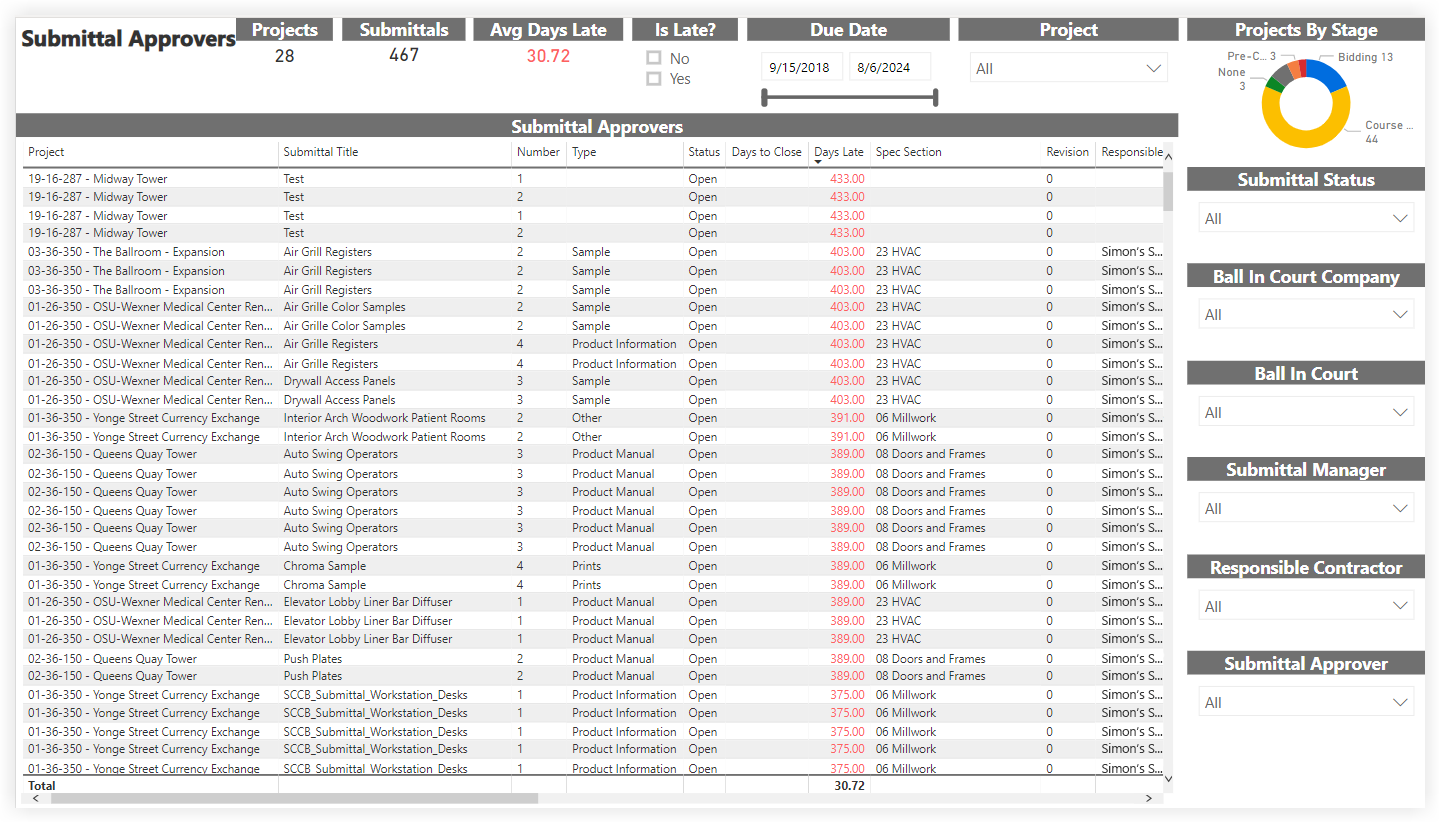
Submittal Approvers
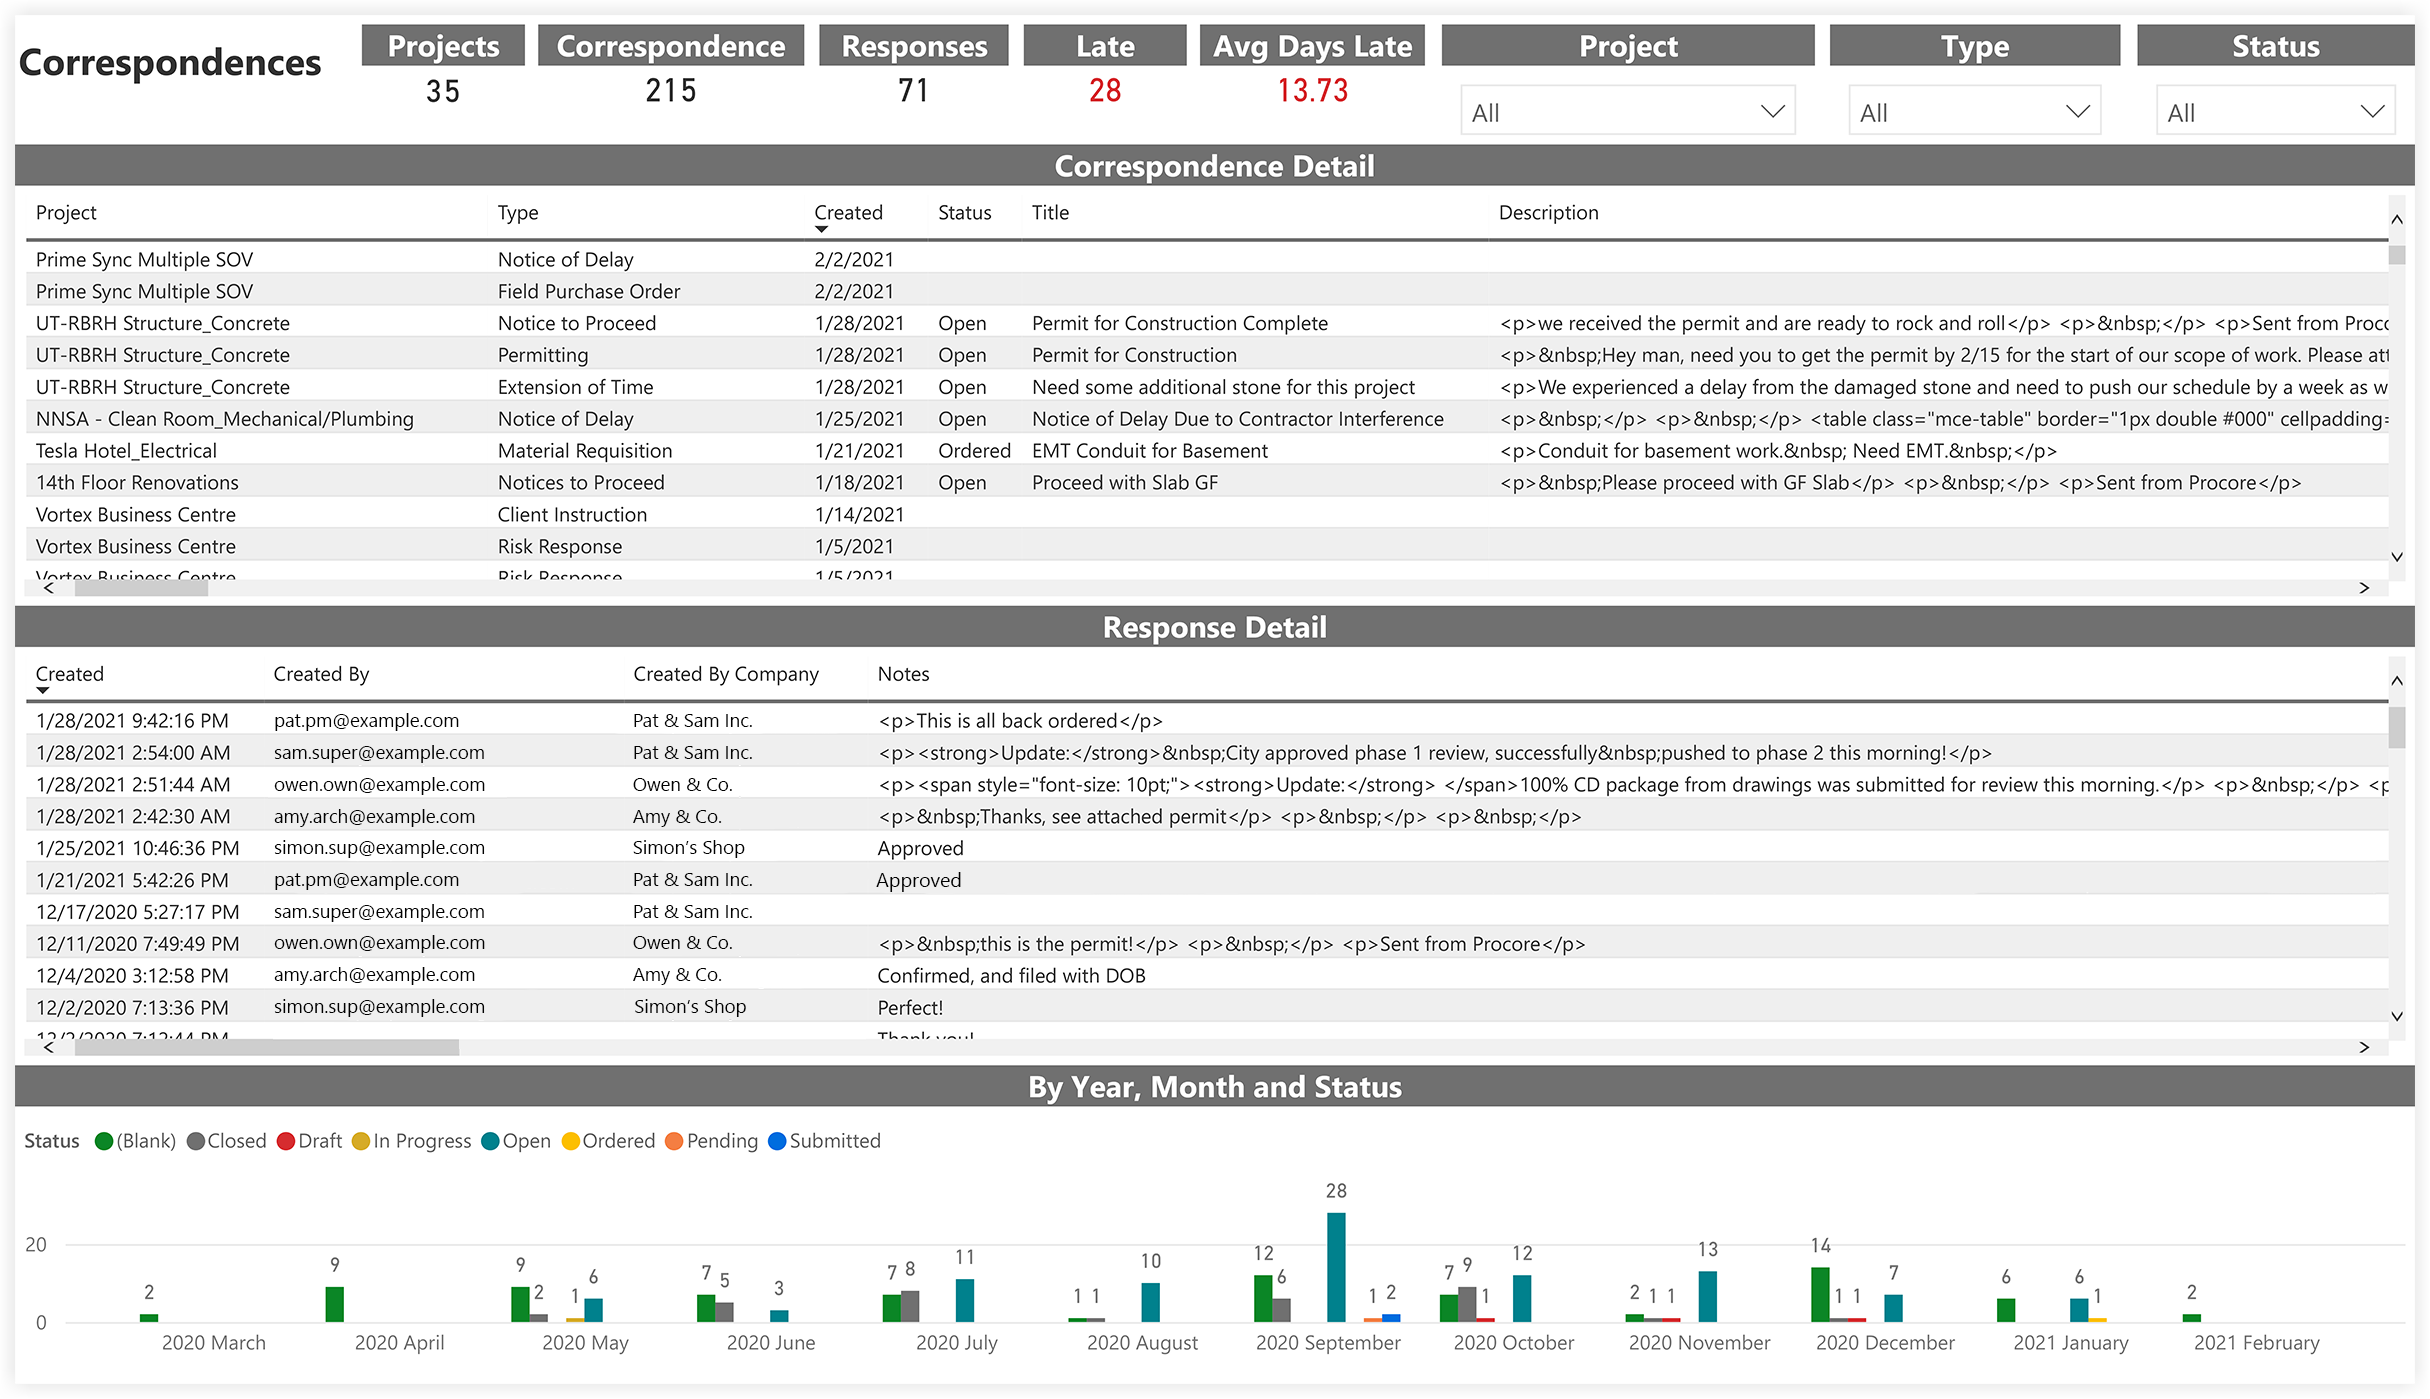
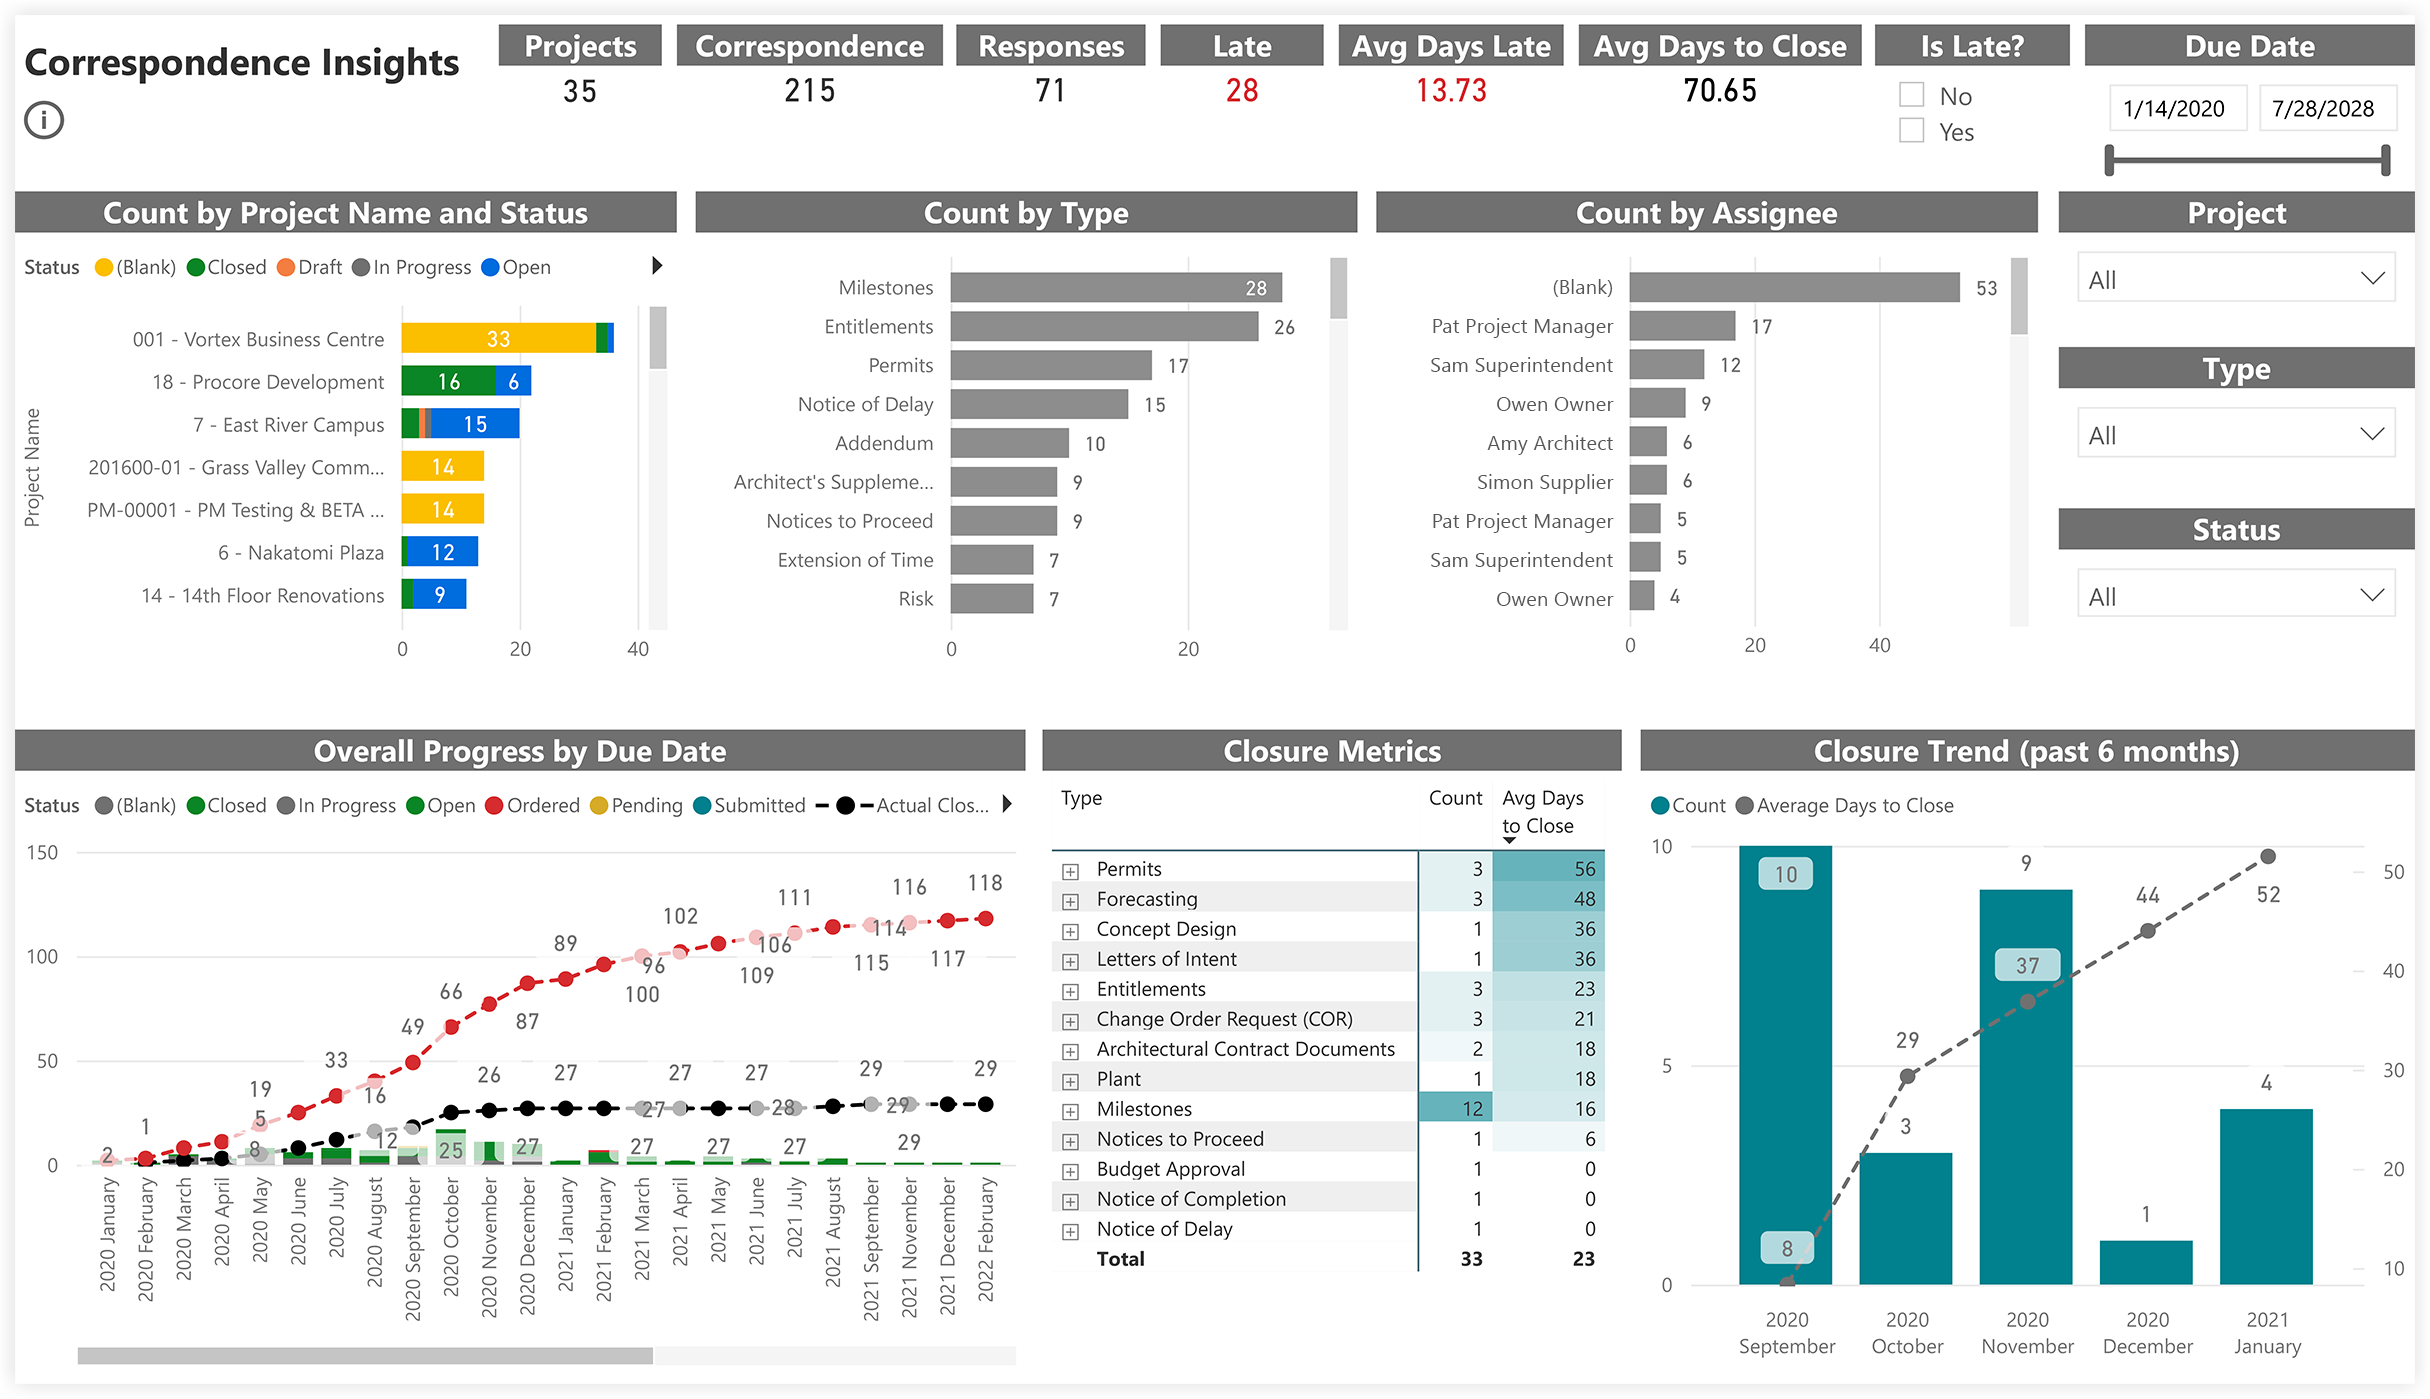
Correspondence Insights
Correspondences