Analyze Variance
Analyze Line Item Variance on the Budget Tab
This action analyzes variance by comparing a snapshot with the active budget.
Navigate to the project's Budget tool.
Select a standard or custom budget view from the View drop-down menu.
Optional: Select a snapshot from the Snapshot drop-down menu.
Note: The Current snapshot is selected by default.Select a snapshot from the Comparison Snapshot drop-down menu to compare the snapshots.
Click the Configure
 icon.
icon.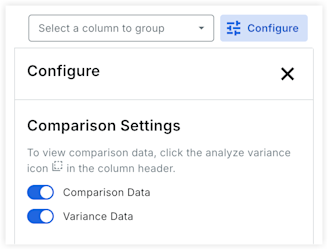
In the Configure panel, under Comparison Settings, click the toggles to enable or disable the following settings:
Comparison Data. Displays the values for line items from the comparison snapshot.
Variance Data. Displays the differences in values for the line items between the snapshots.
Tip
Procore recommends enabling only the Variance Data toggle to quickly identify budget deviations without cluttering your view with full comparison values.
Click the Variance icon in a budget column to expand it and view the snapshots and variance values based on your settings.
Analyze Aggregate Variance Between Snapshots on the Project Status Snapshots Tab
This action analyzes the aggregate variance between two snapshots.
Navigate to the project's Budget tool.
Click the Project Status Snapshots tab and select a standard or custom budget view from the View menu.
Click the snapshot Name to open it.
On a column where it's available, click the Variance icon. This expands the column to show the Current, Previous, and the Variance between the two snapshots.
Example
This example shows the Current, Previous, and Variance columns that appear when you click the Variance icon on a column.
