Project Status Report
Summary
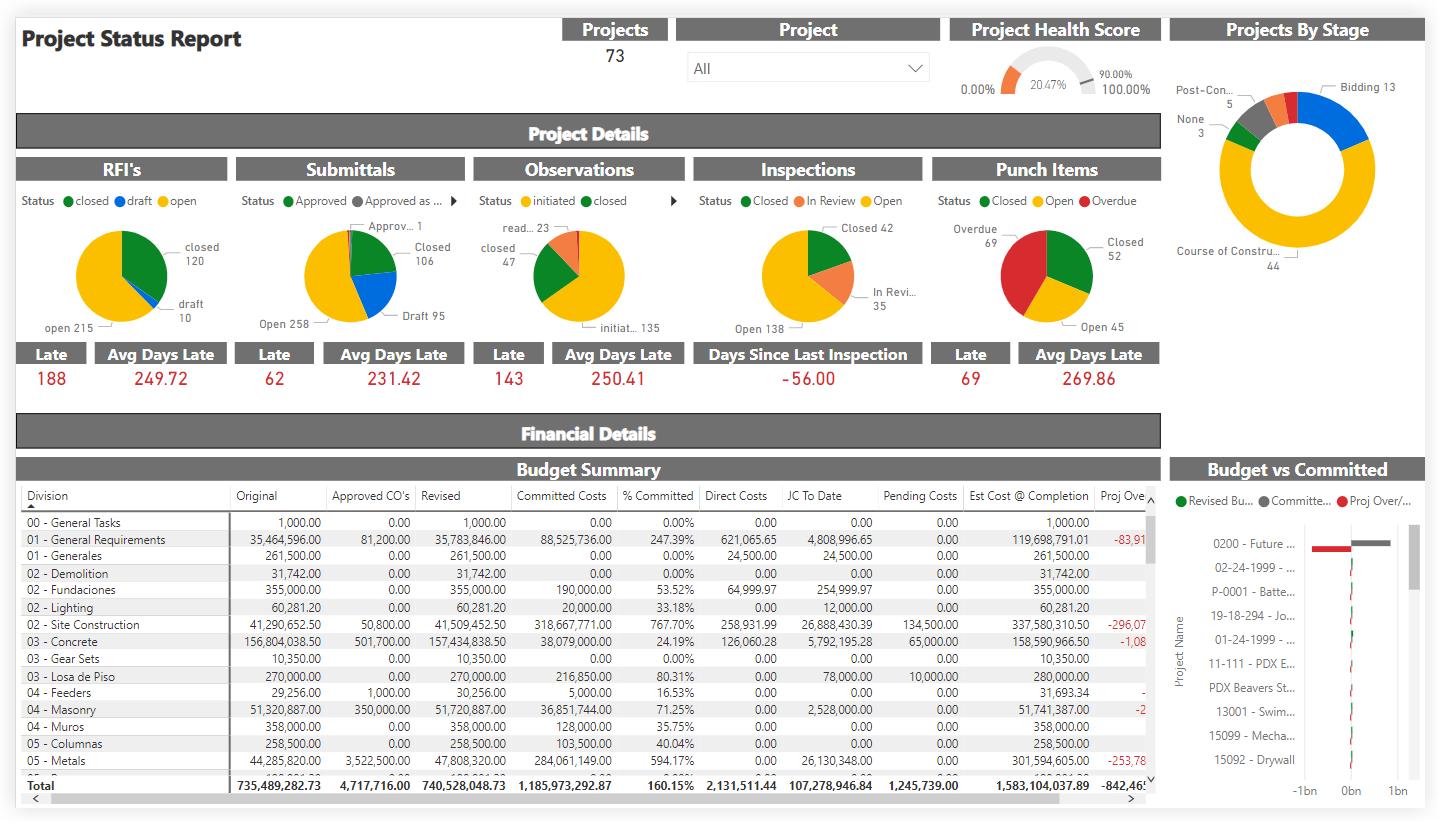
The Project Status Report is part of the Procore Analytics Project Management Report. The scope for the data is set by the selection in the Project drop-down list. Your Procore user account must be added to the appropriate Project level Directory in order to see a project's data reflected in this page. By applying the Project filter, you can expand the scope for an overview of all proejcts or narrow the data in view to a specific project. It also shows your company's overall Project Health Score and a donut chart summary of your company's Projects By Stage, with a count of the project(s) in each stage of construction.
The Project Details area shows item status across your company's projects in a pie chart format. For each item, it also shows a count of the late items and summarizes the average number of days for those late items.
The Financial Details area includes a Budget Summary table that shows budget amounts for the selected project(s) and lists totals by 'Division.'
Tips
Why is there no 'Division' concept in Procore? In Procore's WBS, the 'Cost Code' segment is a tiered segment and there is no concept of 'Division'. Instead, a 'Division' is treated as a tier in a tiered segment. Tiers within a segment are always delimited by a dash (-). Procore's default cost code list has two (2) tiers. However, your environment might have one, two, or multiple tiers. To learn more, see Work Breakdown Structure FAQ.
Can I get a copy of the default cost code list? To download a copy of the default cost code names for your reference, click Procore_Default_Cost_Codes.csv.
Note: This CSV file is for reference only and not formatted for imports into Procore.
The Budget vs. Committed area plots the budgeted values and committed values on your projects using a two-sided bar graph for easy reading.
Sample Report Page
This sample report page was created using mock data for demonstration purposes only.