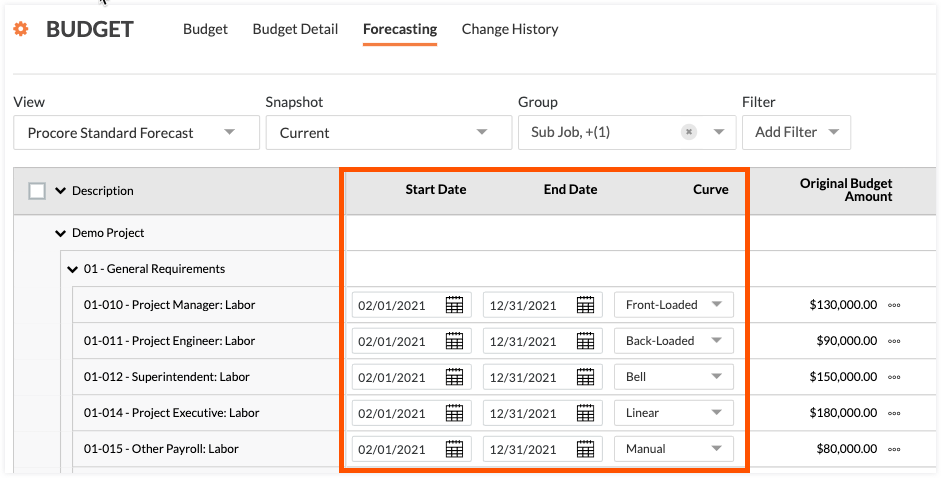
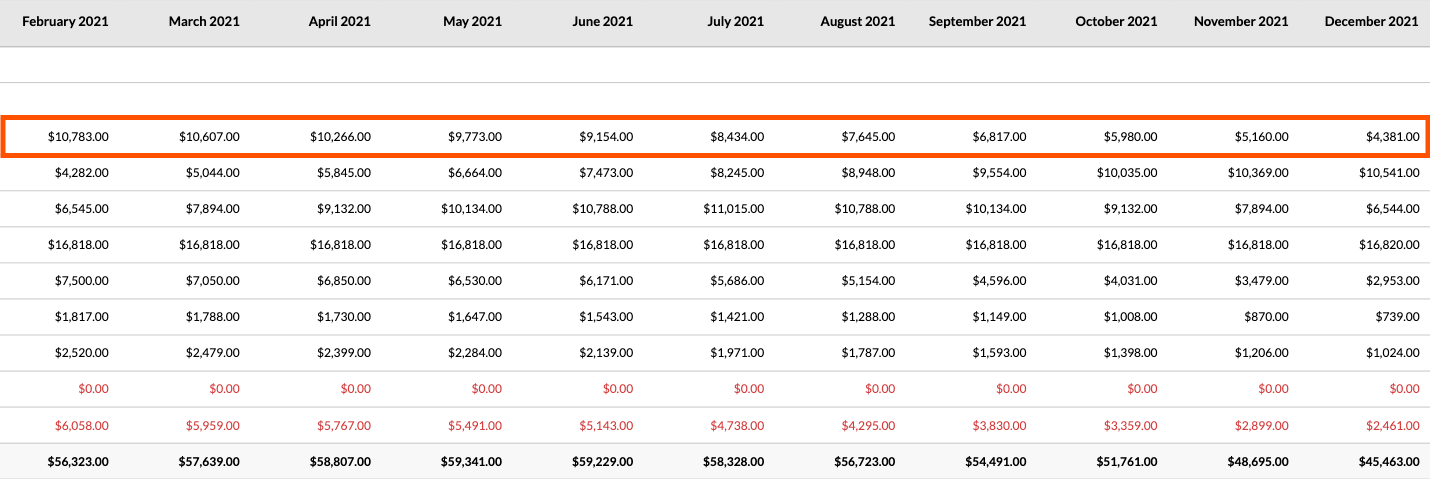
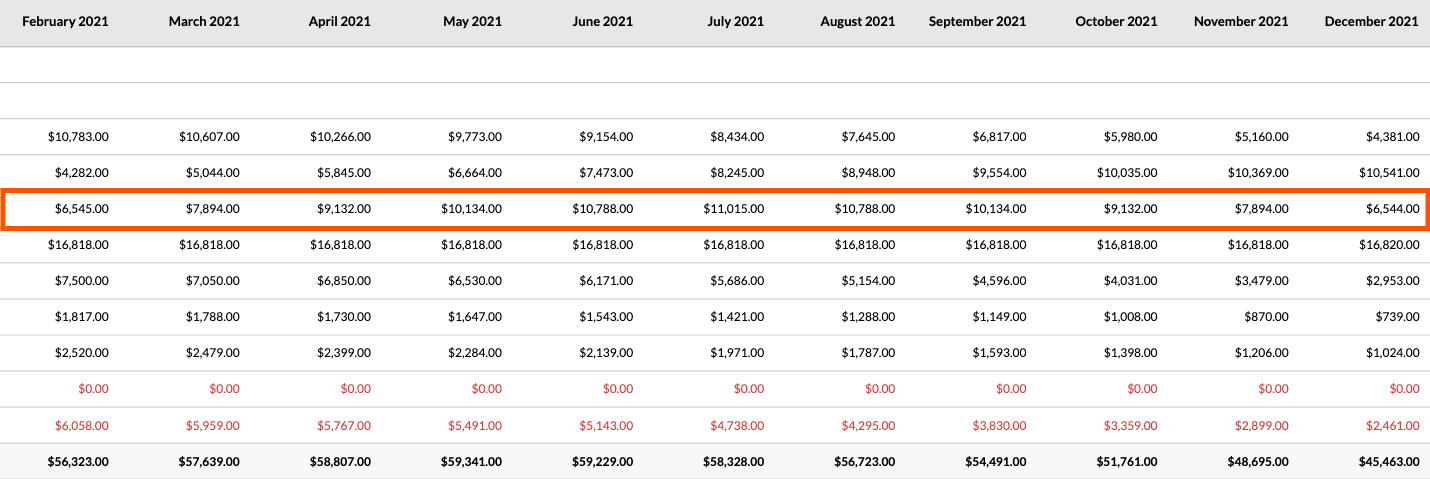
Appliquer des courbes de prévision avancées

Background

Using the forecasting curves with the 'Procore Standard Forecast' view, you can view your construction project's monthly cost projections by spreading the 'Projected Cost to Complete' column value across a time period that you define. Your company's can also create a customized forecast view to define which column value to spread using these curves:

  • Front-Loaded. Select this menu option so the spread shows more spending at the beginning of the timeline and less spending at the end of the timeline.

  • Back-Loaded. Select this menu option to adjust the spread shows less spending at beginning of the timeline and more at the end of the timeline.

  • Bell. Select this option to menu adjust the spread to show less spending at the beginning and end of the and more spending at the middle of the timeline.

  • Linear. Select this menu option to evenly spread the amount in the 'Project Cost to Complete' column over the selected timeline.

  • Manual. Although not a menu option, you can also manually update any of the forecast amounts in the table. This action automatically places you into 'Manual' entry mode.

Examples of each curve are detailed below.

Éléments à prendre en compte

  • Autorisations utilisateur requises :

    • Autorisations de niveau « Standard » dans l’outil Budget du projet.

  • Informations complémentaires :

    • Cet affichage de prévision prend en charge les prévisions mensuelles. Les prévisions trimestrielles ne sont pas disponibles à l’heure actuelle.

 Tip

How does Procore calculate the advanced forecasting curves? To learn more, see How do Procore's 'Advanced Forecasting' curves distribute 'Projected Cost to Complete Amounts' amounts?

Escalier

  1. Accédez à l’outil Budget du projet.

  2. Cliquez sur l’onglet Prévisions .

  3. Sélectionnez la vue des prévisions dans le menu Vue . Dans cet exemple, nous avons sélectionné la vue « Prévision standard Procore ». Toutefois, votre administrateur Procore peut créer des vues personnalisées pour votre environnement. Voir Configurer une nouvelle vue de prévisions.

  4. Appliquez une courbe à l’aide de l’une (1) de ces options :

    1. Pour appliquer une courbe à un seul poste , procédez comme suit :

      • Date de début. Sélectionnez une date de début pour votre période de prévision.

      • Date de fin. Sélectionnez une date de fin pour votre période de prévision.

      • Courbe. Sélectionnez la courbe à appliquer à votre période de prévision. Faites ensuite défiler vers le côté droit de la page pour voir vos prévisions pour la période spécifiée.

        forecasting-line-items.png

    2. Pour appliquer une courbe à vos postes par lot, procédez comme suit :

      • Pour sélectionner tous les postes du projet, cochez la case à côté du champ Description .

      • Pour sélectionner un ou plusieurs postes, placez le curseur de votre souris sur le côté gauche du tableau jusqu’à ce qu’une case à cocher apparaisse. Cochez ensuite la ou les cases souhaitées, puis procédez comme suit dans les champs qui apparaissent au-dessus du tableau :* Date de début. Sélectionnez une date de début pour votre période de prévision.* Date de fin. Sélectionnez une date de fin pour votre période de prévision.* Courbe. Sélectionnez la courbe à appliquer à votre période de prévision. Faites ensuite défiler vers la droite de la page pour voir vos prévisions pour la période spécifiée.* Postulez. Cliquez sur ce bouton pour appliquer la courbe spécifiée aux postes que vous avez sélectionnés.

        forecasting-bulk-actions.png

Exemples

Les exemples ci-dessous détaillent chaque courbe de prévision avancée :

  • Courbe à chargement frontal

  • Courbe d’investissement arrière

  • Courbe en cloche

  • Courbe linéaire

  • Courbe manuelle

Courbe à chargement frontal

Example

In the first line item on our example budget, we selected the 'Front-Loaded Curve' option so the spread shows more spending at the beginning of the timeline and less spending at the end of the timeline. As shown below, the value in the 'Projected Cost to Complete' is $89,000.00.

forecast-projected-cost-to-complete-1.png

When you scroll to the right, notice how the front-loaded curve spreads that $89,000.00 over the 10-month forecast period. As shown below, this spread shows more spending at the beginning of the timeline and less spending at the end of the timeline.

forecasting-front-loaded-curve-1.png

Courbe d’investissement arrière

Example

In the second line item on our example budget, we selected the 'Back-Loaded Curve' option to adjust the spread shows less spending at beginning of the timeline and more at the end of the timeline. As shown below, the value in 'Projected Cost to Complete' is $87,000.00.

forecast-projected-cost-to-complete-2.png

When you scroll to the right, notice how the front-loaded curve spreads that $87,000.00 over the 10-month forecast period. As shown below, this spread shows less spending at the beginning of the timeline and more spending at the end of the timeline.

forecasting-back-loaded-curve-2.png

Courbe en cloche

Example

In the third line item on our example budget, we selected the 'Bell' option to adjust the spread to show less spending at the beginning and end and more spending at the middle of the timeline. As shown below, the value in 'Projected Cost to Complete' is $100,000.00.

forecast-projected-cost-to-complete-3.png

When you scroll to the right, notice how the bell curve spreads that $100,000.00 over the 10-month forecast period. As shown below, this spread shows less spending at the beginning and end of the timeline and more spending at the middle of the timeline.

forecasting-bell-curve-3.png

Courbe linéaire

Example

In the fourth line item on our example budget, we selected the 'Linear' option to adjust the spread to evenly distribute the amount in the 'Project Cost to Complete' column over the selected timeline. As shown below, the value in 'Projected Cost to Complete' is $185,000.00.

forecast-projected-cost-to-complete-4.png

When you scroll to the right, notice how the linear curve evenly spreads $185,000.000 over the 10-month forecast period as shown below.

forecasting-linear-curve-4.png

Courbe manuelle

Example

In the fifth line item on our example budget, we entered custom amounts in each of the monthly forecast columns. Although manual is not a menu option, the action of typing a values places the line item into 'Manual' entry mode so you can set each month's cost projection on the budget line item.

forecast-projected-cost-to-complete-5.png

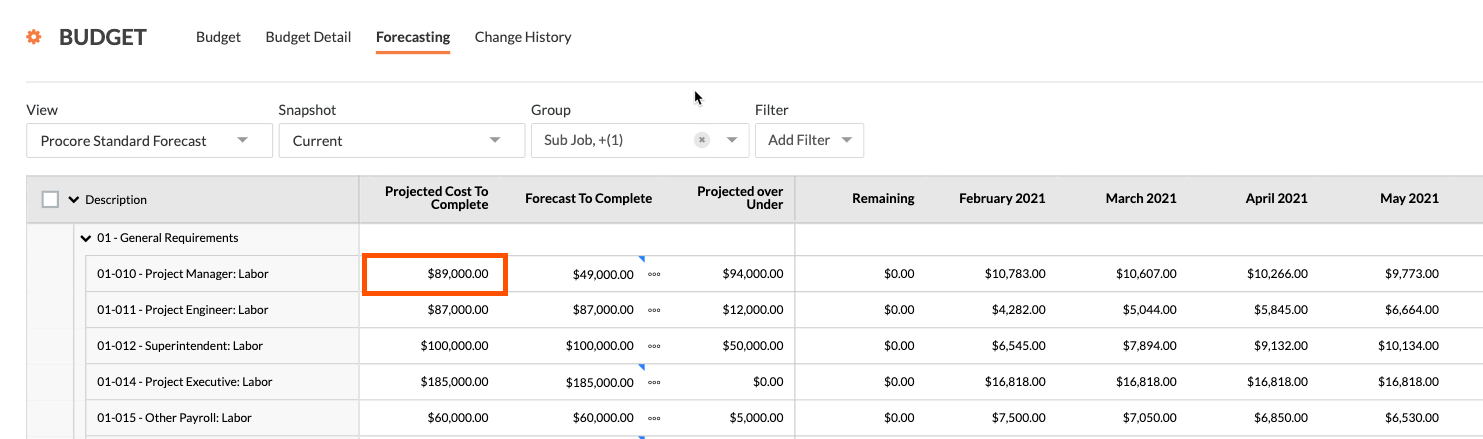
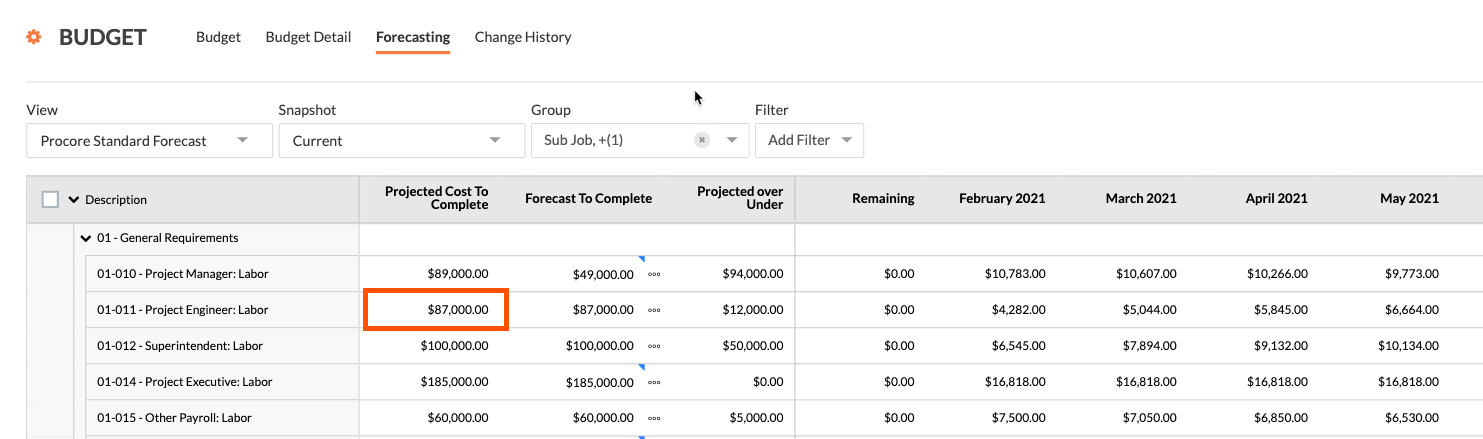
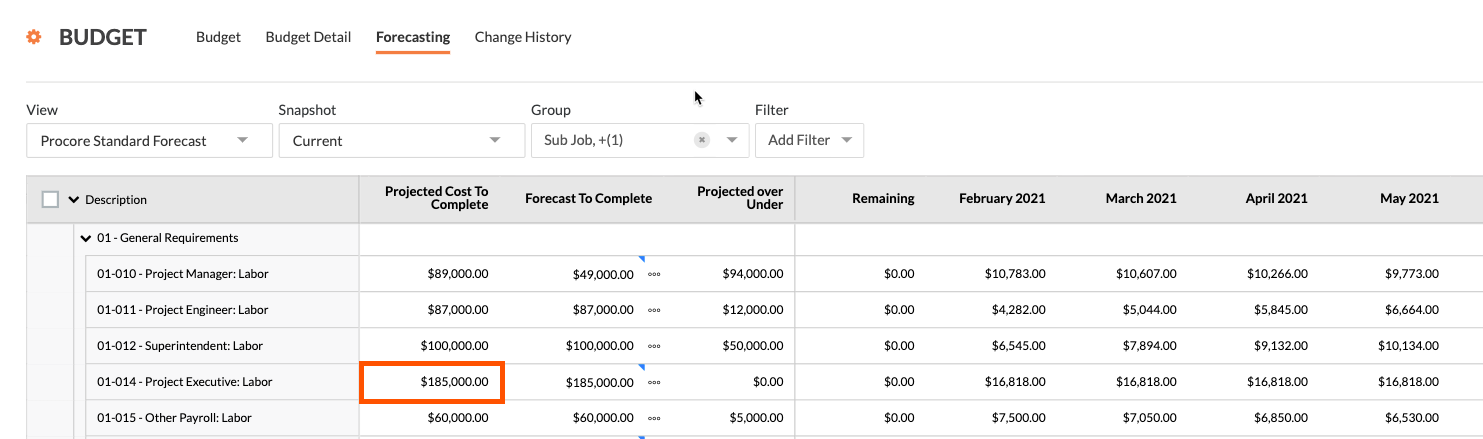
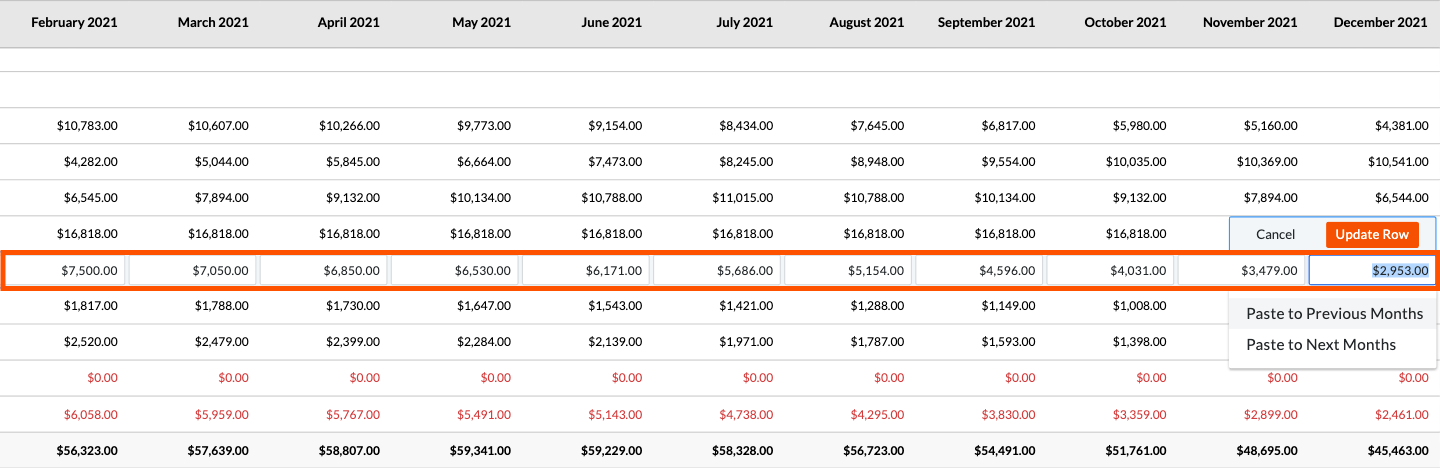
When you scroll to the right, you can click into the individual cells on the line item to manually enter your own values and spread monthly spending as needed. After entering the value, click the Update Row button. You also have the option to paste the amount you enter here to all previous months or to all of the following months. If you make a mistake, simply click Cancel.

forecasting-manual-5.png

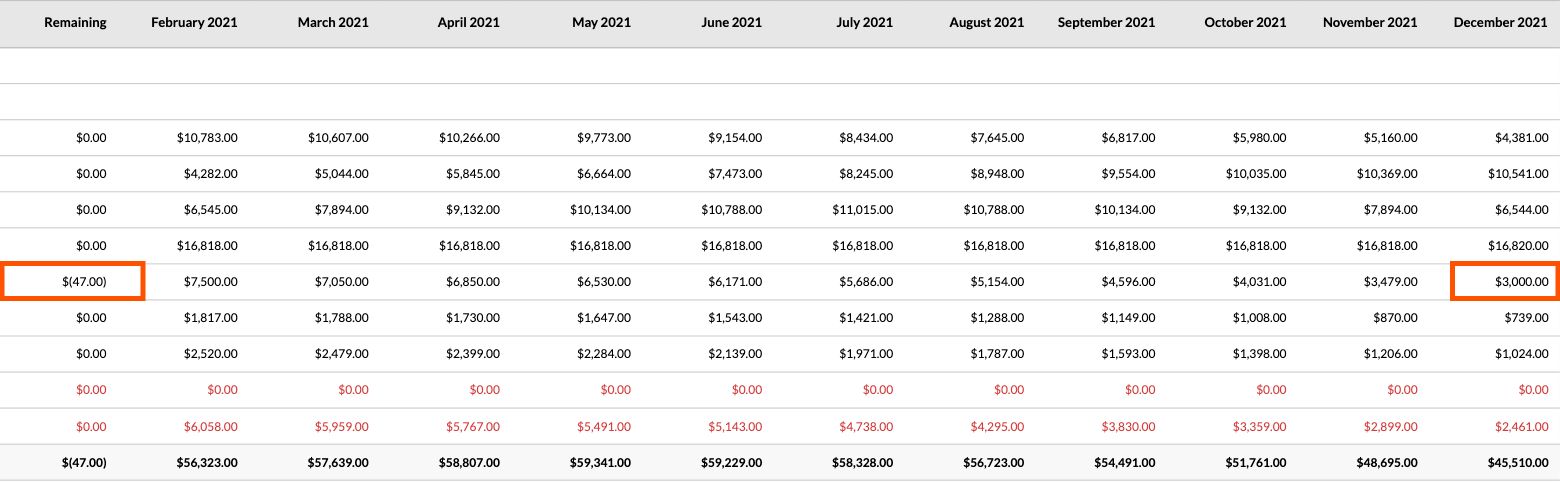
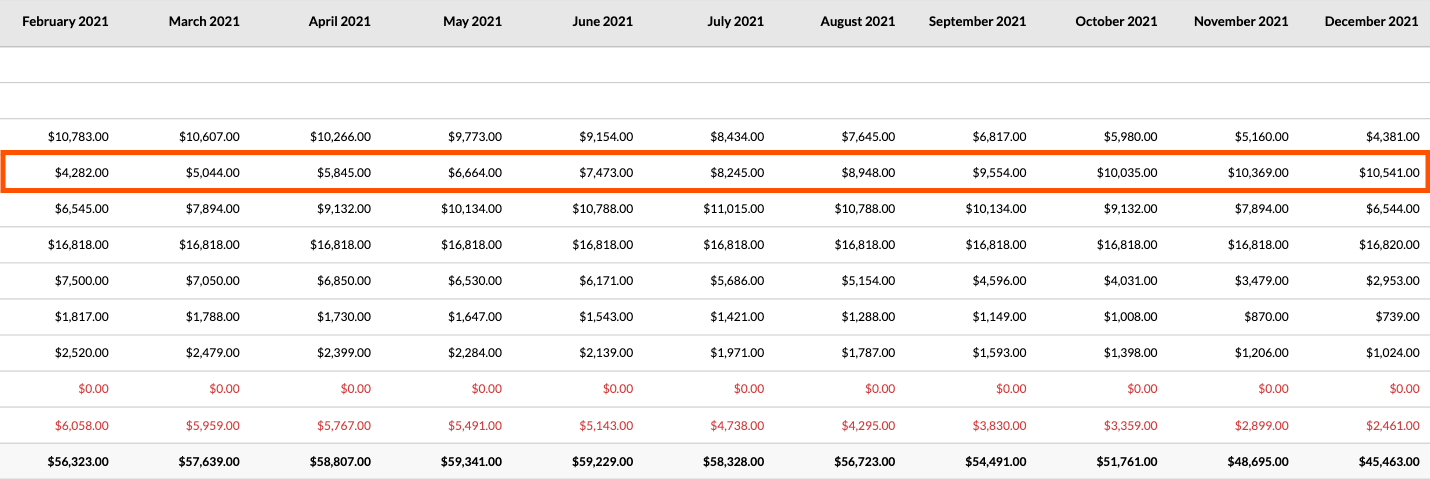
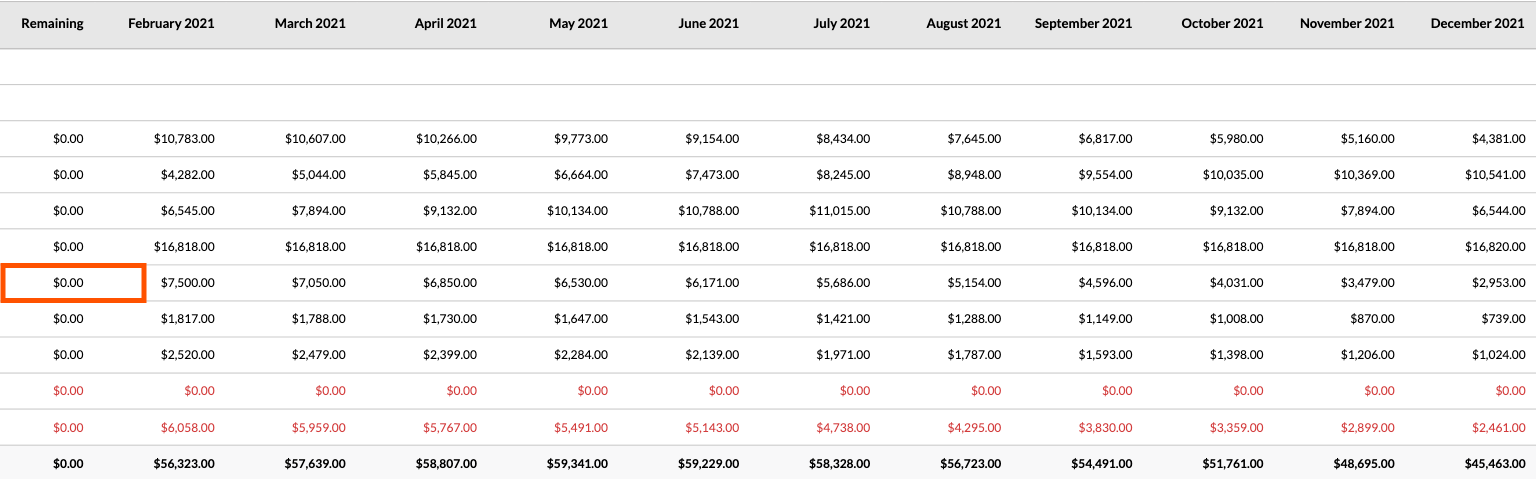
After Procore updates the row, the value in the 'Remaining' column updates to show you how many dollars you have left to allocate. When you have allocated the correct amount, the column value should read $0.00 as shown below.

forecast-remaining-zero.png

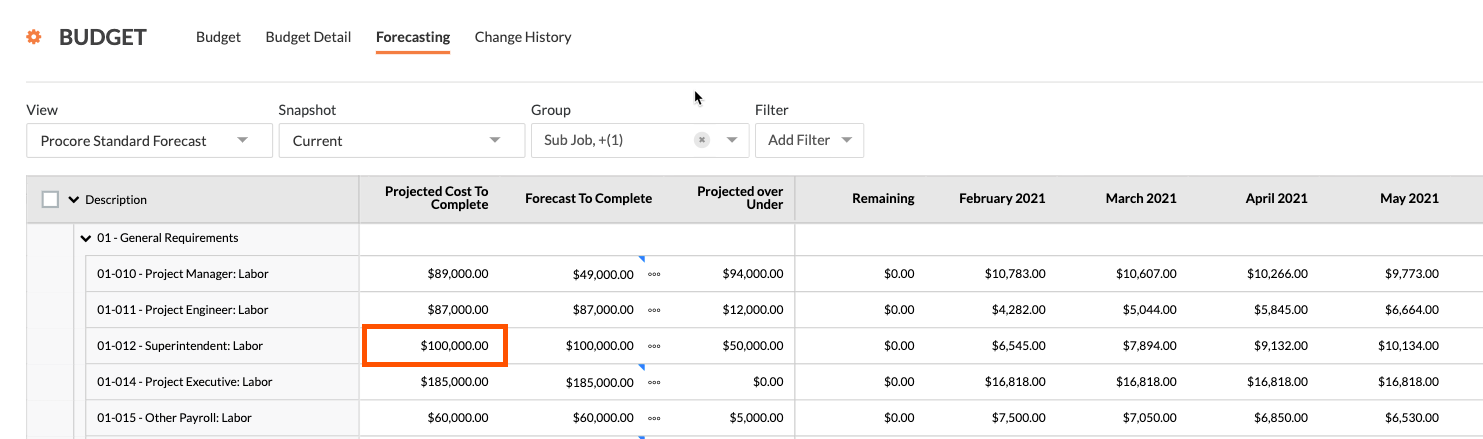
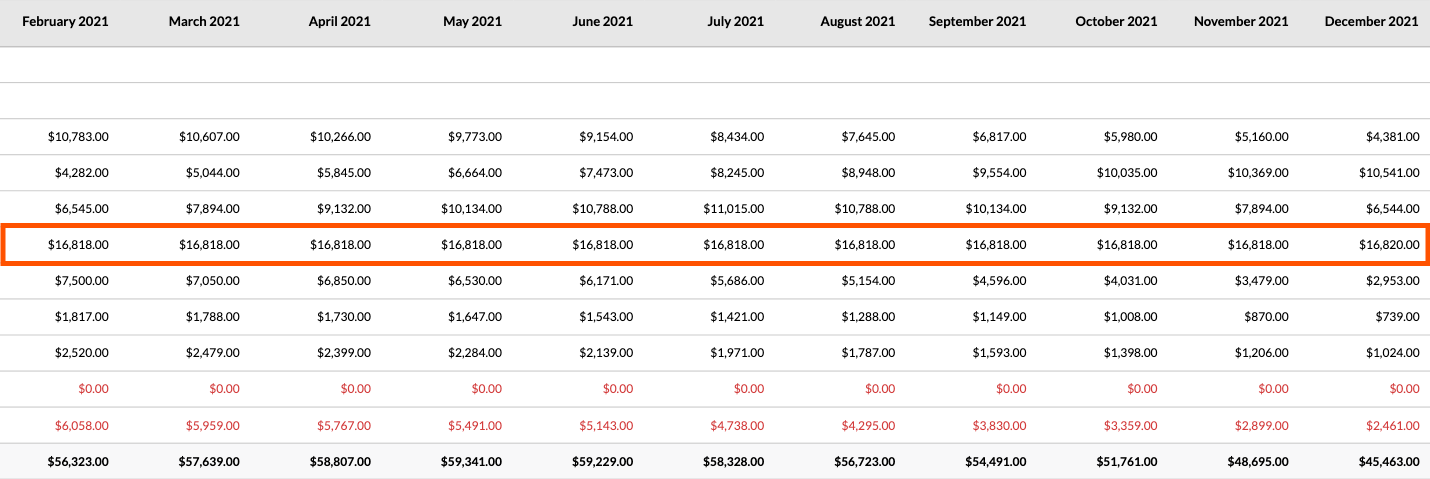
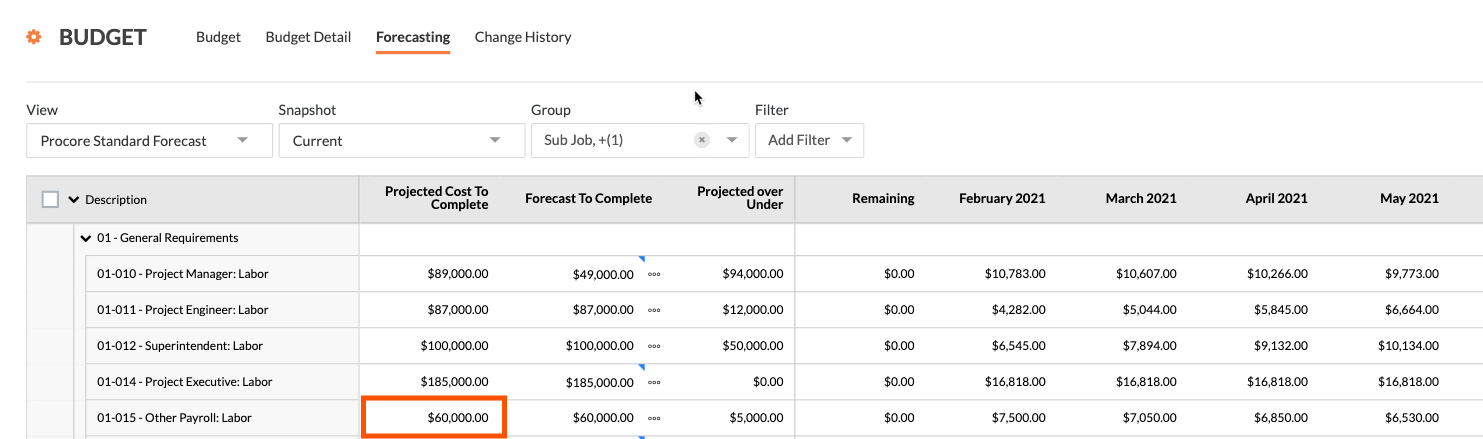
If you over-allocate the amount, the 'Remaining' column will show a negative amount in parens, as shown below.

forecasting-over-allocated.png

See Also

Loading related articles...