Project Status Report
Summary
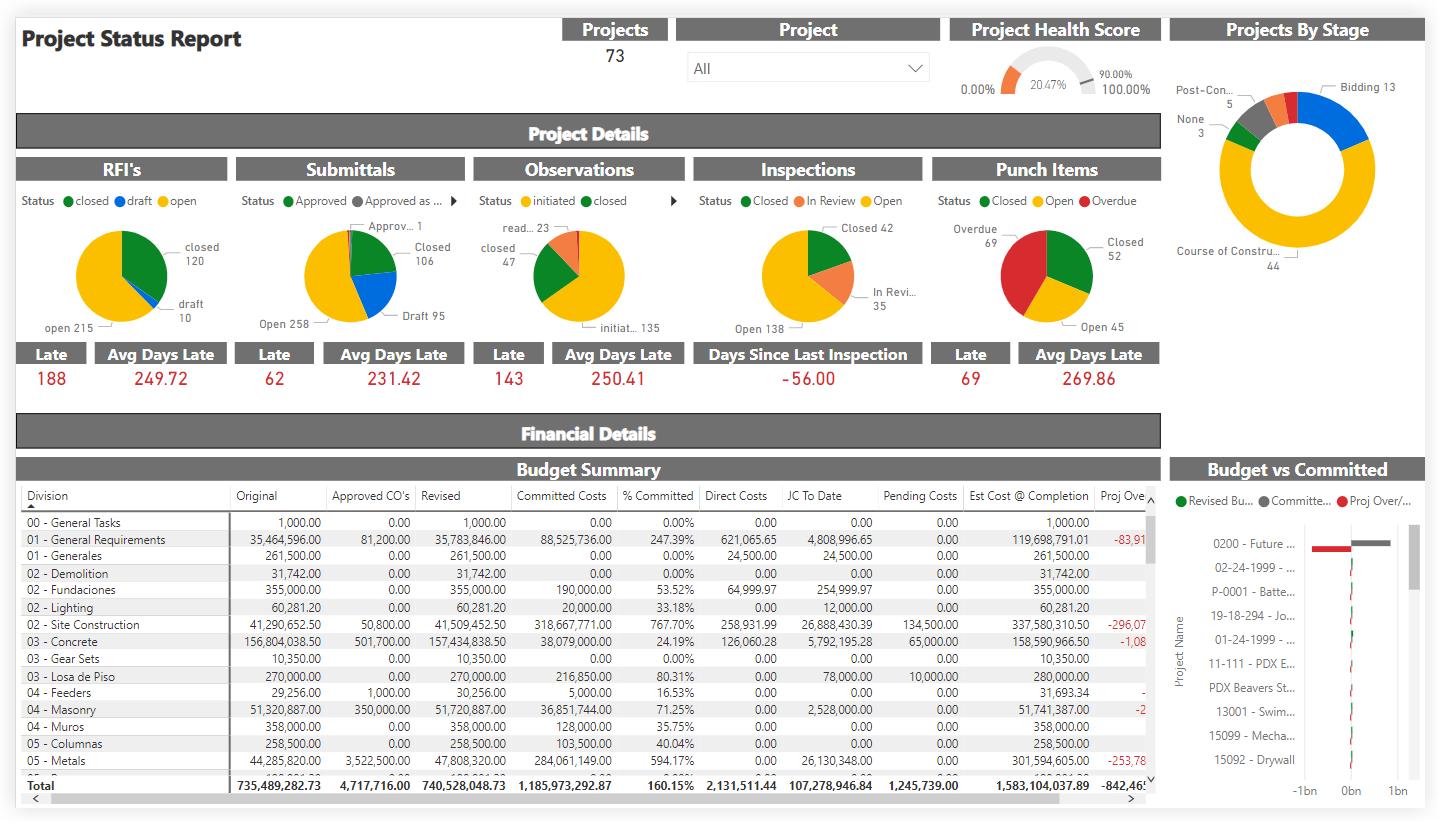
The Project Status Report is part of the Procore Analytics Project Management Report. The scope for the data is set by the selection in the Project drop-down list. Your Procore user account must be added to the appropriate Project level Directory in order to see a project's data reflected in this page. By applying the Project filter, you can expand the scope for an overview of all proejcts or narrow the data in view to a specific project. It also shows your company's overall Project Health Score and a donut chart summary of your company's Projects By Stage, with a count of the project(s) in each stage of construction.
The Project Details area shows item status across your company's projects in a pie chart format. For each item, it also shows a count of the late items and summarizes the average number of days for those late items.
The Financial Details area includes a Budget Summary table that shows budget amounts for the selected project(s) and lists totals by 'Division.'
ヒント
なぜ Procore には「区分」という概念がないのですか?Procore の作業分解構成図では、「費用コード」セグメントは階層化セグメントであり、「区分」の概念はありません。代わりに、「区分」は階層化セグメント内の階層として扱われます。セグメント内の階層は常にダッシュ (-) で区切られます。Procore の既定の費用コード リストには2つの階層があります。ただし、環境には 1 つ、2 つ、または複数の階層がある場合があります。詳細については、「 作業分解構成図に関する FAQ」を参照してください。
既定の費用コード リストのコピーを入手できますか?参照用に既定の費用コード名のコピーをダウンロードするには、[ Procore_Default_Cost_Codes.csv] をクリックします。手記: この CSV ファイルは参照専用であり、Procore にインポートできるようにフォーマットされていません。
The Budget vs. Committed area plots the budgeted values and committed values on your projects using a two-sided bar graph for easy reading.
Sample Report Page
This sample report page was created using mock data for demonstration purposes only.