Afficher le tableau de bord Santé financière dans l’outil Portefeuille
Fond
Le tableau de bord de santé de cet outil Portefeuille transforme les informations de chaque projet en intelligence d’affaires en agrégeant les données de votre entreprise sur l’ensemble des projets et des outils, ce qui vous donne un instantané puissant de la santé globale de l’ensemble de votre portefeuille. Avec le tableau de bord de santé, les utilisateurs ont désormais la possibilité d’examiner des visualisations de données simples, mais efficaces, qui fournissent un meilleur aperçu des performances du projet dans l’ensemble du portefeuille de votre entreprise. En examinant un large éventail de points de données de projet et de mesures financières, le tableau de bord de santé met également en évidence les projets et les problèmes qui peuvent nécessiter votre attention.
Éléments à prendre en compte
Autorisation utilisateur requise:
Pour accéder à l’outil Portefeuille, autorisation de niveau « Lecture seule » ou supérieure dans l’outil Portefeuille de l’entreprise.
ETPour afficher l’onglet Tableau de bord de santé financière dans l’outil Portefeuille, autorisation de niveau « Standard » ou supérieure dans l’outil Rapports de l’entreprise.
Remarques:Si vous êtes un utilisateur disposant d’une autorisation de niveau « Admin », vous pouvez voir tous les projets.
Si vous êtes un utilisateur disposant d’une autorisation de niveau « Standard », vous pouvez afficher les projets auxquels votre profil d’utilisateur est ajouté à l’annuaire du projet.
La case « Est un employé de » doit être cochée dans votre profil d’utilisateur.
Pour afficher la zone Santé financière du tableau de bord, Autorisation « Admin » dans l’outil Admin de l’entreprise et « Standard » ou supérieure dans l’outil Budget du projet. Pour plus d’informations, voir Configurer une vue du budget pour les rapports personnalisés
Remarques:La zone Santé financière du tableau de bord limite l’affichage des données aux budgets du projet auxquels vous êtes autorisé à accéder.
Par exemple, si vous n’avez accès qu’à trois (3) budgets de projet, les données ne concernent que ces trois (3) projets. Si vous avez l’autorisation d’accès à tous les projets, les données de tous les projets sont affichées.
Recommandations:
Pour tirer le meilleur parti de votre tableau de bord Santé financière, il est recommandé que vous (ou un utilisateur autorisé de votre entreprise) créiez les éléments suivants à utiliser avec Procore :Configurez l’outil Budget pour utiliser la vue « Budget standard Procore (vue des rapports personnalisés) ». Il s’agit du paramètre par défaut de Procore. Voir Configurer une vue du budget pour les rapports personnalisés.
Remarque: si le tableau de bord de santé financière n’affiche pas les informations budgétaires, consultez Pourquoi mon tableau de bord de santé financière n’est-il pas configuré ?Les sélections qui apparaissent dans le menu déroulant Ajouter des filtres sont créées dans d’autres outils. Pour plus d’informations, consultez l’un de ces tutoriels :
Ministères. Voir Ajouter un service personnalisé.
Noms des projets. Voir Ajouter un nouveau projet ou Modifier le nom d’un projet Procore.
Programmes. Voir Ajouter un programme personnalisé.
Régions. Voir Ajouter une région de projet personnalisée.
Étapes. Voir Ajouter une étape de projet personnalisée.
Limites:
Actuellement, les widgets des paramètres de configuration par défaut du tableau de bord de santé financière ne peuvent pas être personnalisés.
Steps
View the Health Dashboard
Add Filters to the Health Dashboard
View the Health Dashboard
Navigate to your company's Portfolio tool.
The Portfolio page appears. After you create a project, this page lists all the projects in your company's Procore account.Click Health Dashboard.
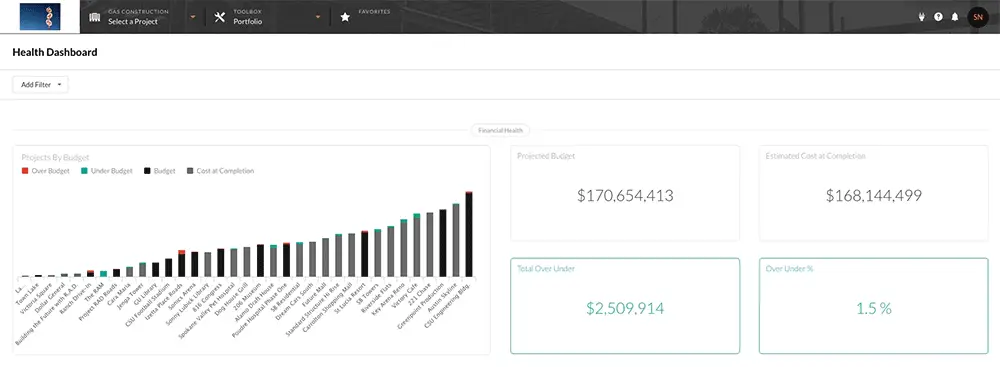
This reveals the Health Dashboard.In the Financial Health area, evaluate the data as follows:
Notes:To learn how to use the Add Filter menu, see Add Filters to the Health Dashboard.
Currently, the configuration settings for the widgets in the Health Dashboard cannot be customized.
The data you can view in the Financial Health area depends upon the permissions you've been granted to the Budget tools in your projects.
Projects by Budget
Reveals a bar chart showing the Procore projects in your company's account by their budgeted amounts (i.e., lowest to highest from left to right). Click the color-coded labels in the legend to adjust the projects in view to quickly pinpoint those that are Over Budget and Under Budget, as well as to compare each project's Budget and Cost at Completion. See Set up a Budget.Projected Budget
Reveals a snapshot of the estimated future financial performance across every project in your company's Portfolio tool.Estimated Cost at Completion
Provides a snapshot of your project's total estimated costs at project completion.Total Over Under
Shows the aggregated total (i.e., over budget or under budget) for the project's in your company's Portfolio tool. A GREEN outline and text indicates your projects are under budget. A RED outline and text indicates your projects are over budget.Over Under %
Shows the percentage by which your projects are over or under the projected budget. This value is determined by taking the difference between projected budget and estimated cost at completion and dividing it by the projected budget.
Scroll down to the Company Health by Project area. A table lists the following data for you to evaluate:
Notes:You can hover over data fields to view more specific information.
You can view all of the data in the table. However, you will need permission to the corresponding Procore tool to navigate to other tools using these steps:
Click the button in the tooltip that appears to open the corresponding tool in a new browser tab.
Click the hyperlinks in Procore Name, Project Stage, and Projected Over Under columns to open the corresponding tool in a new browser tab.
If you are a user with 'Standard' level permission, you will be able to view projects to which your user profile is added to the Project Directory.
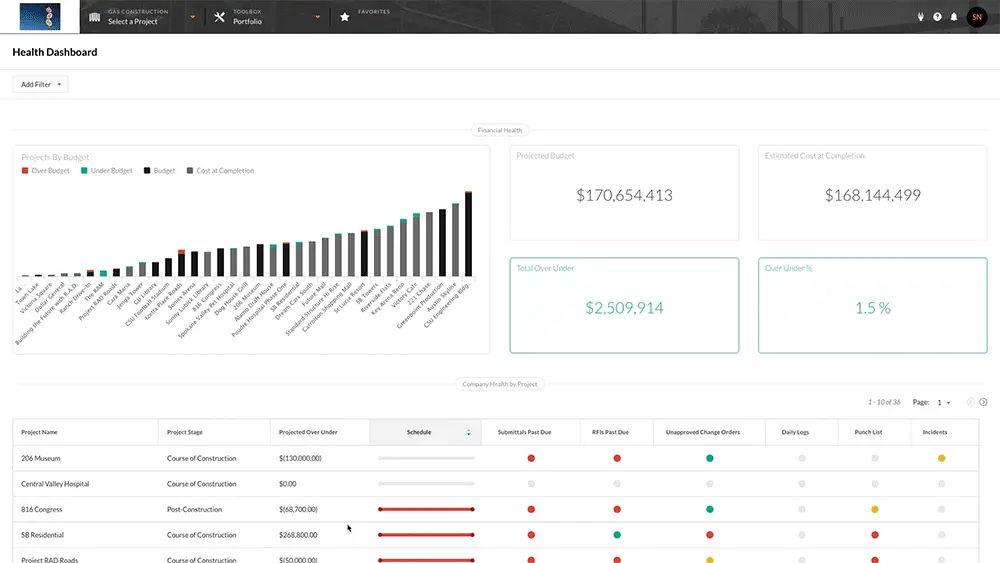
Project Name
Lists the project's name as entered in the system. See Add a New Project or Change the Name of a Procore Project. Click the project name's hyperlink to open the project's Home page in a new browser tab. See About the Project Home Page.Project Stage
Reveals each project's current stage. To create custom project stages for use in Procore, see Add a Custom Project Stage. To change the stage setting for a Procore project, see Change a Project's Stage of Construction. Click the project stage hyperlink to open the Project Admin tool in a new browser tab. See Admin.Projected Over Under
Shows the total amount over or under budget for each listed project. See Set up a New Budget View and Set up a Budget.
Note: If you have 'Admin' level permission on the Budget tool, click the hyperlink in the Projected Over Under column to open the project's Budget tool in a new browser tab. See Budget.Schedule
Provides a horizontal graph that users can hover their mouse cursor over to reveal details about the project schedule: Start Date, Completion date, and Days Past Due. Click the Go to Schedule button to open the Project Admin tool (Note: The dates in this graph correspond to either the (1) Estimated Start Date and the _Estimated Completion D_ate or (2) the Actual Start Date and Projected Finish Date). To learn more about the color codes on the indicator, see Health Dashboard Threshold Settings: Schedule.Submittals Past Due
Provides a color-coded dot that users can hover their mouse cursor over to reveal the status of a project's submittals. Click the Go to Submittals button to open the Submittals tool. To learn about the color-codes on the indicator, see Health Dashboard Threshold Settings: Submittals.RFIs Past Due
Provides a color-coded indicator that users can hover their mouse cursor over to reveal the status of a project's RFIs. Click the Go to RFIs button to open the RFIs tool. To learn about the color-codes on the indicator, see Health Dashboard Threshold Settings: RFIs.Unapproved Change Orders
Provides a color-coded indicator that users can hover their mouse cursor over to reveal the status of a projects open change orders in an unapproved status. Click the Go to Change Orders button to open the Change Orders tool. To learn more, see Health Dashboard Threshold Settings: Unapproved Change Orders.Daily Log
Provides a color-coded indicator that users can hover their mouse cursor over for a better understanding of when a Manpower Log (see Create Manpower Entries) or Notes Log (see Create Notes Entries) were created in the project's Daily Log tool. This indicator looks at the last seven (7) days to report on the actual date the log entry was created and NOT the date for which the entries themselves were added). Click the Go to Daily Log button to open the Daily Log tool. To learn more, see Health Dashboard Threshold Settings: Daily Logs.Punch List
Provides a color-coded indicator that users can hover their mouse cursor over to reveal the status of punch list items on a project. Click the Go to Punch List button to open the Punch List tool. To learn more, see Health Dashboard Threshold Settings: Punch List.Incidents
Provides a color-coded indicator that users can hover their mouse cursor over to reveal the status of incidents on a project. Click the Go to Incidents button to open the Incidents tool. To learn more, see Health Dashboard Threshold Settings: Incidents.
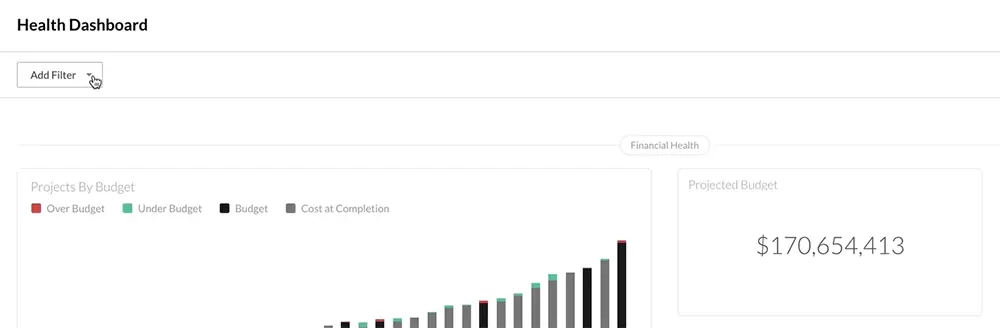
Add Filters to the Health Dashboard
If you want to apply filters to narrow the viewable information displaying in the Health Dashboard, select one of these options from the Add Filter drop-down list at the top of the Health Dashboard page. When you select an option from the drop-down menu, you will be presented with a secondary drop-down list from which you can select secondary filters to narrow the list on the dashboard further.
To add a filter to the dashboard, place a checkmark in the corresponding box in the drop-down menu. The filters you apply will update the charts, tiles, and tables.
To clear all filters from the dashboard, click Clear All.
See Also
Loading related articles...